Database is 11.2.0.3 running on Solaris SVR40-be-64bit 8.1.0, 32 CPU's.
The database is used by many connected libraries, to check books in and out, query for overdues etc.
On busy days, performance seems to be all over the map, some areas reporting 40 seconds for a form to update, some areas < 2 seconds. The transactions that seem to cause the bottlenecks seem to be queries checking if a patron has overdues, fines etc.
I've been tasked to try and find where the bottlenecks are, and find out if the long delays are caused by server contention, application code, network & internet issues, or within the database itself.
The server is a Solaris M5000 with about 16 other Oracle databases, 128GB RAM
I have run ADDM reports, trying to catch busy periods. One recommendation was increase the SGA size, which was at 1.8Gb to 2.5, so on the next database bounce SGA was increased to 3GB and AMM was implemented, but the SGA never seems to get above 1.9GB in size.
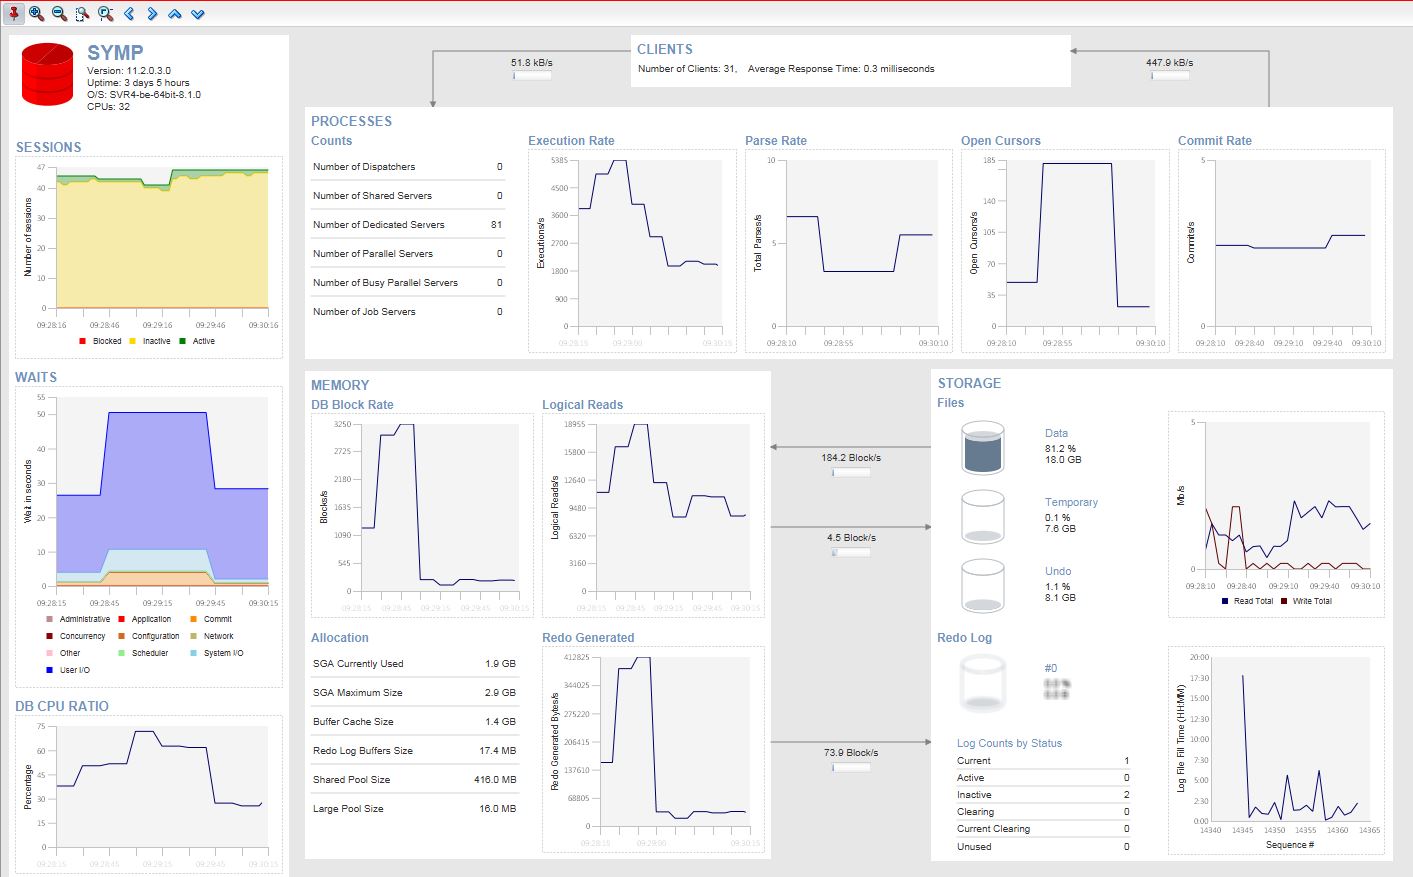
Here is a snapshot from instance viewer on a typical busy day.
Below is the output from ADDM for the hour immediately preceding the above.
================================================================================
     _ADDM Report for Task 'report feb 7'_

      _-----------------------------------_
Analysis Period
---------------
AWR snapshot range from 34564 to 34565.
Time period starts at 07-FEB-17 08.00.56 AM
Time period ends at 07-FEB-17 09.00.58 AM
Analysis Target
---------------
Database 'xxxx' with DB ID 2322079177.
Database version 11.2.0.3.0.
Analysis was requested for all instances, but ADDM analyzed instance SYMP,
numbered 1 and hosted at xxxx.
See the "Additional Information" section for more information on the requested
instances.
Activity During the Analysis Period
-----------------------------------
Total database time was 1931 seconds.
The average number of active sessions was .54.
ADDM analyzed 1 of the requested 1 instances.
Summary of Findings
-------------------
Description Active Sessions Recommendations
_Percent of Activity_
---------------------------------------- ------------------- ---------------
1 Virtual Memory Paging .54 | 100 1
2 Top SQL Statements .23 | 43.14 6
3 "User I/O" wait Class .23 | 43.06 0
4 Top Segments by "User I/O" and "Cluster" .14 | 26.16 5
~~~~~~~~~~~~~~~~~~~~~~~~~~~~~~~~~~~~~~~~~~~~~~~~~~~~~~~~~~~~~~~~~~~~~~~~~~~~~~
~~~~~~~~~~~~~~~~~~~~~~~~~~~~~~~~~~~~~~~~~~~~~~~~~~~~~~~~~~~~~~~~~~~~~~~~~~~~~~
      _Findings and Recommendations_

      _----------------------------_
Finding 1: Virtual Memory Paging
Impact is .54 active sessions, 100% of total activity.
------------------------------------------------------
Significant virtual memory paging was detected on the host operating system.
Recommendation 1: Host Configuration
Estimated benefit is .54 active sessions, 100% of total activity.
-----------------------------------------------------------------
Action
  _Host operating system was experiencing significant paging but no_

  _particular root cause could be detected. Investigate processes that do_

  _not belong to this instance running on the host that are consuming_

  _significant amount of virtual memory. Also consider adding more physical_

  _memory to the host._
Finding 2: Top SQL Statements
Impact is .23 active sessions, 43.14% of total activity.
--------------------------------------------------------
SQL statements consuming significant database time were found. These
statements offer a good opportunity for performance improvement.
Recommendation 1: SQL Tuning
Estimated benefit is .07 active sessions, 12.42% of total activity.
-------------------------------------------------------------------
Action
  _Run SQL Tuning Advisor on the SELECT statement with SQL\_ID_

  _"2zky76mt3dtnz"._

  _Related Object_

     _SQL statement with SQL\_ID 2zky76mt3dtnz._

     _select /\*+ INDEX(item item\_key) \*/ item.\*, rowid from item where_

     _catalog\_key = :1 and call\_sequence = :2 and copy\_number = :3_
Rationale
  _The SQL spent 100% of its database time on CPU, I/O and Cluster waits._

  _This part of database time may be improved by the SQL Tuning Advisor._
Rationale
  _Database time for this SQL was divided as follows: 100% for SQL_

  _execution, 0% for parsing, 0% for PL/SQL execution and 0% for Java_

  _execution._
Rationale
  _SQL statement with SQL\_ID "2zky76mt3dtnz" was executed 1937344 times and_

  _had an average elapsed time of 0.00012 seconds._
Rationale
  _I/O and Cluster wait for TABLE "SIRSI.ITEM" with object ID 59004_

  _consumed 47% of the database time spent on this SQL statement._
Recommendation 2: SQL Tuning
Estimated benefit is .06 active sessions, 11.76% of total activity.
-------------------------------------------------------------------
Action
  _Run SQL Tuning Advisor on the SELECT statement with SQL\_ID_

  _"6khb1xv7us4r1"._

  _Related Object_

     _SQL statement with SQL\_ID 6khb1xv7us4r1._

     _select /\*+ INDEX(marc0 marc0\_key) \*/ marc0.\*, rowid from marc0 where_

     _marc = :1_
Rationale
  _The SQL spent 100% of its database time on CPU, I/O and Cluster waits._

  _This part of database time may be improved by the SQL Tuning Advisor._
Rationale
  _Database time for this SQL was divided as follows: 100% for SQL_

  _execution, 0% for parsing, 0% for PL/SQL execution and 0% for Java_

  _execution._
Rationale
  _SQL statement with SQL\_ID "6khb1xv7us4r1" was executed 26069 times and_

  _had an average elapsed time of 0.0066 seconds._
Rationale
  _I/O and Cluster wait for TABLE "SIRSI.MARC0" with object ID 59022_

  _consumed 61% of the database time spent on this SQL statement._
Rationale
  _I/O and Cluster wait for INDEX "SIRSI.MARC0\_KEY" with object ID 59023_

  _consumed 33% of the database time spent on this SQL statement._
Recommendation 3: SQL Tuning
Estimated benefit is .04 active sessions, 6.54% of total activity.
------------------------------------------------------------------
Action
  _Run SQL Tuning Advisor on the SELECT statement with SQL\_ID_

  _"5gr56zs9taqs6"._

  _Related Object_

     _SQL statement with SQL\_ID 5gr56zs9taqs6._

     _select_

     _REDO\_SIZE.value as REDO\_SIZE_

     _,REDO\_WASTAGE.value as REDO\_WASTAGE_

     _,REDO\_ENTRIES.value as REDO\_ENTRIES_

     _,REDO\_BLOCKS\_WRITTEN.value as REDO\_BLOCKS\_WRITTEN_

     _,REDO\_BLOCKS\_CHECKSUMMED.value as REDO\_BLOCKS\_CHECKSUMMED_

     _,REDO\_WRITES.value as REDO\_WRITES_

     _,REDO\_LOG\_SPACE\_REQUESTS.value as REDO\_LOG\_SPACE\_REQUESTS_

     _,REDO\_BUFFER\_ALLOC\_RETRIES.value as REDO\_BUFFER\_ALLOC\_RETRIES_

     _,REDO\_WRITE\_TIME.value as REDO\_WRITE\_TIME_

     _,REDO\_KB\_READ.value as REDO\_KB\_READ_

     _,REDO\_SYNCH\_WRITES.value as REDO\_SYNCH\_WRITES_

     _,REDO\_BLKS\_RD\_FOR\_RECOVERY.value as REDO\_BLKS\_RD\_FOR\_RECOVERY_

     _,REDO\_SYNCH\_TIME.value as REDO\_SYNCH\_TIME_

     _,REDO\_K\_BS\_READ\_FOR\_RECOVERY.value as REDO\_K\_BS\_READ\_FOR\_RECOVERY_

     _,REDO\_SIZE\_FOR\_DIRECT\_WRITES.value as REDO\_SIZE\_FOR\_DIRECT\_WRITES_

     _,REDO\_LOG\_SPACE\_WAIT\_TIME.value as REDO\_LOG\_SPACE\_WAIT\_TIME_

     _,REDO\_ORDERING\_MARKS.value as REDO\_ORDERING\_MARKS_

     _from_

     _(select min(value) as value from v$sysstat where name = 'redo size')_

     _REDO\_SIZE_

     _,(select min(value) as value from v$sysstat where name = 'redo_

     _wastage') REDO\_WASTAGE_

     _,(select min(value) as value from v$sysstat where name = 'redo_

     _entries') REDO\_ENTRIES_

     _,(select min(value) as value from v$sysstat where name = 'redo blocks_

     _written') REDO\_BLOCKS\_WRITTEN_

     _,(select min(value) as value from v$sysstat where name = 'redo blocks_

     _checksummed by FG (exclusive)') REDO\_BLOCKS\_CHECKSUMMED_

     _,(select min(value) as value from v$sysstat where name = 'redo_

     _writes') REDO\_WRITES_

     _,(select min(value) as value from v$sysstat where name = 'redo log_

     _space requests') REDO\_LOG\_SPACE\_REQUESTS_

     _,(select min(value) as value from v$sysstat where name = 'redo buffer_

     _allocation retries') REDO\_BUFFER\_ALLOC\_RETRIES_

     _,(select min(value) as value from v$sysstat where name = 'redo write_

     _time') REDO\_WRITE\_TIME_

     _,(select min(value) as value from v$sysstat where name = 'redo KB_

     _read') REDO\_KB\_READ_

     _,(select min(value) as value from v$sysstat where name = 'redo synch_

     _writes') REDO\_SYNCH\_WRITES_

     _,(select min(value) as value from v$sysstat where name = 'redo blocks_

     _read for recovery') REDO\_BLKS\_RD\_FOR\_RECOVERY_

     _,(select min(value) as value from v$sysstat where name = 'redo synch_

     _time') REDO\_SYNCH\_TIME_

     _,(select min(value) as value from v$sysstat where name = 'redo_

     _k-bytes read for recovery') REDO\_K\_BS\_READ\_FOR\_RECOVERY_

     _,(select min(value) as value from v$sysstat where name = 'redo size_

     _for direct writes') REDO\_SIZE\_FOR\_DIRECT\_WRITES_

     _,(select min(value) as value from v$sysstat where name = 'redo log_

     _space wait time') REDO\_LOG\_SPACE\_WAIT\_TIME_

     _,(select min(value) as value from v$sysstat where name = 'redo_

     _ordering marks') REDO\_ORDERING\_MARKS_
Rationale
  _The SQL spent 100% of its database time on CPU, I/O and Cluster waits._

  _This part of database time may be improved by the SQL Tuning Advisor._
Rationale
  _Database time for this SQL was divided as follows: 100% for SQL_

  _execution, 0% for parsing, 0% for PL/SQL execution and 0% for Java_

  _execution._
Rationale
  _SQL statement with SQL\_ID "5gr56zs9taqs6" was executed 696 times and had_

  _an average elapsed time of 0.17 seconds._
Recommendation 4: SQL Tuning
Estimated benefit is .03 active sessions, 5.88% of total activity.
------------------------------------------------------------------
Action
  _Run SQL Tuning Advisor on the SELECT statement with SQL\_ID_

  _"b2sy91m0k196m"._

  _Related Object_

     _SQL statement with SQL\_ID b2sy91m0k196m._

     _select /\*+ INDEX(callnum call\_key) \*/ callnum.\*, rowid from callnum_

     _where catalog\_key = :1 and call\_sequence = :2_
Rationale
  _The SQL spent 100% of its database time on CPU, I/O and Cluster waits._

  _This part of database time may be improved by the SQL Tuning Advisor._
Rationale
  _Database time for this SQL was divided as follows: 100% for SQL_

  _execution, 0% for parsing, 0% for PL/SQL execution and 0% for Java_

  _execution._
Rationale
  _SQL statement with SQL\_ID "b2sy91m0k196m" was executed 63735 times and_

  _had an average elapsed time of 0.001 seconds._
Rationale
  _I/O and Cluster wait for TABLE "SIRSI.CALLNUM" with object ID 58825_

  _consumed 55% of the database time spent on this SQL statement._
Recommendation 5: SQL Tuning
Estimated benefit is .02 active sessions, 3.27% of total activity.
------------------------------------------------------------------
Action
  _Run SQL Tuning Advisor on the SELECT statement with SQL\_ID_

  _"9ajkb4xnr8czq"._

  _Related Object_

     _SQL statement with SQL\_ID 9ajkb4xnr8czq._

     _select /\*+ INDEX(ucat ucat\_key) \*/ ucat.\*, rowid from ucat where_

     _user\_key > :1_
Rationale
  _The SQL spent 100% of its database time on CPU, I/O and Cluster waits._

  _This part of database time may be improved by the SQL Tuning Advisor._
Rationale
  _Database time for this SQL was divided as follows: 100% for SQL_

  _execution, 0% for parsing, 0% for PL/SQL execution and 0% for Java_

  _execution._
Rationale
  _SQL statement with SQL\_ID "9ajkb4xnr8czq" was executed 1253012 times and_

  _had an average elapsed time of 0.000042 seconds._
Recommendation 6: SQL Tuning
Estimated benefit is .02 active sessions, 3.27% of total activity.
------------------------------------------------------------------
Action
  _Run SQL Tuning Advisor on the SELECT statement with SQL\_ID_

  _"gxvqh9vbhvk4m"._

  _Related Object_

     _SQL statement with SQL\_ID gxvqh9vbhvk4m._

     _select /\*+ INDEX(item item\_id) \*/ item.\*, rowid from item where id =_

     _:1_
Rationale
  _The SQL spent 100% of its database time on CPU, I/O and Cluster waits._

  _This part of database time may be improved by the SQL Tuning Advisor._
Rationale
  _Database time for this SQL was divided as follows: 100% for SQL_

  _execution, 0% for parsing, 0% for PL/SQL execution and 0% for Java_

  _execution._
Rationale
  _SQL statement with SQL\_ID "gxvqh9vbhvk4m" was executed 13083 times and_

  _had an average elapsed time of 0.0024 seconds._
Rationale
  _I/O and Cluster wait for INDEX "SIRSI.ITEM\_ID" with object ID 59315_

  _consumed 100% of the database time spent on this SQL statement._
Finding 3: "User I/O" wait Class
Impact is .23 active sessions, 43.06% of total activity.
--------------------------------------------------------
Wait class "User I/O" was consuming significant database time.
The throughput of the I/O subsystem was not significantly lower than expected.
The Oracle instance memory (SGA and PGA) was adequately sized.
No recommendations are available.
Finding 4: Top Segments by "User I/O" and "Cluster"
Impact is .14 active sessions, 26.16% of total activity.
--------------------------------------------------------
Individual database segments responsible for significant "User I/O" and
"Cluster" waits were found.
Recommendation 1: Segment Tuning
Estimated benefit is .04 active sessions, 8.18% of total activity.
------------------------------------------------------------------
Action
  _Investigate application logic involving I/O on TABLE "SIRSI.ITEM" with_

  _object ID 59004._

  _Related Object_

     _Database object with ID 59004._
Action
  _Look at the "Top SQL Statements" finding for SQL statements consuming_

  _significant I/O on this segment. For example, the SELECT statement with_

  _SQL\_ID "2zky76mt3dtnz" is responsible for 71% of "User I/O" and_

  _"Cluster" waits for this segment._
Rationale
  _The I/O usage statistics for the object are: 0 full object scans, 32617_

  _physical reads, 2870 physical writes and 0 direct reads._
Recommendation 2: Segment Tuning
Estimated benefit is .03 active sessions, 6% of total activity.
---------------------------------------------------------------
Action
  _Investigate application logic involving I/O on TABLE "SIRSI.CALLNUM"_

  _with object ID 58825._

  _Related Object_

     _Database object with ID 58825._
Action
  _Look at the "Top SQL Statements" finding for SQL statements consuming_

  _significant I/O on this segment. For example, the SELECT statement with_

  _SQL\_ID "b2sy91m0k196m" is responsible for 54% of "User I/O" and_

  _"Cluster" waits for this segment._
Rationale
  _The I/O usage statistics for the object are: 0 full object scans, 18214_

  _physical reads, 2837 physical writes and 0 direct reads._
Recommendation 3: Segment Tuning
Estimated benefit is .03 active sessions, 6% of total activity.
---------------------------------------------------------------
Action
  _Investigate application logic involving I/O on TABLE "SIRSI.MARC0" with_

  _object ID 59022._

  _Related Object_

     _Database object with ID 59022._
Action
  _Look at the "Top SQL Statements" finding for SQL statements consuming_

  _significant I/O on this segment. For example, the SELECT statement with_

  _SQL\_ID "6khb1xv7us4r1" is responsible for 100% of "User I/O" and_

  _"Cluster" waits for this segment._
Rationale
  _The I/O usage statistics for the object are: 0 full object scans, 13053_

  _physical reads, 6 physical writes and 0 direct reads._
Recommendation 4: Segment Tuning
Estimated benefit is .02 active sessions, 3.27% of total activity.
------------------------------------------------------------------
Action
  _Investigate application logic involving I/O on INDEX "SIRSI.MARC0\_KEY"_

  _with object ID 59023._

  _Related Object_

     _Database object with ID 59023._
Action
  _Look at the "Top SQL Statements" finding for SQL statements consuming_

  _significant I/O on this segment. For example, the SELECT statement with_

  _SQL\_ID "6khb1xv7us4r1" is responsible for 100% of "User I/O" and_

  _"Cluster" waits for this segment._
Rationale
  _The I/O usage statistics for the object are: 0 full object scans, 5984_

  _physical reads, 2 physical writes and 0 direct reads._
Recommendation 5: Segment Tuning
Estimated benefit is .01 active sessions, 2.73% of total activity.
------------------------------------------------------------------
Action
  _Investigate application logic involving I/O on INDEX "SIRSI.ITEM\_ID"_

  _with object ID 59315._

  _Related Object_

     _Database object with ID 59315._
Action
  _Look at the "Top SQL Statements" finding for SQL statements consuming_

  _significant I/O on this segment. For example, the SELECT statement with_

  _SQL\_ID "gxvqh9vbhvk4m" is responsible for 100% of "User I/O" and_

  _"Cluster" waits for this segment._
Rationale
  _The I/O usage statistics for the object are: 0 full object scans, 2976_

  _physical reads, 35 physical writes and 0 direct reads._
Symptoms That Led to the Finding:
---------------------------------
  _Wait class "User I/O" was consuming significant database time._

  _Impact is .23 active sessions, 43.06% of total activity._
~~~~~~~~~~~~~~~~~~~~~~~~~~~~~~~~~~~~~~~~~~~~~~~~~~~~~~~~~~~~~~~~~~~~~~~~~~~~~~
~~~~~~~~~~~~~~~~~~~~~~~~~~~~~~~~~~~~~~~~~~~~~~~~~~~~~~~~~~~~~~~~~~~~~~~~~~~~~~
      _Additional Information_

      _----------------------_
Miscellaneous Information
-------------------------
Wait class "Application" was not consuming significant database time.
Wait class "Commit" was not consuming significant database time.
Wait class "Concurrency" was not consuming significant database time.
Wait class "Configuration" was not consuming significant database time.
CPU was not a bottleneck for the instance.
Wait class "Network" was not consuming significant database time.
Session connect and disconnect calls were not consuming significant database
time.
Hard parsing of SQL statements was not consuming significant database time.
======================================================================================
The same or similar queries seem to come up in all of these reports. When I run the SQL from a sqlplus prompt they run instantly.
I notice that logical reads are consistently high, there is a lot of IO in the database and that the temp tablespace in this database is pretty well unused.
Talking to the application administrator here she said that sometimes it seems to be just certain geographical areas reporting issues, but is unable to say if that's just coincidence or if some areas just don't report slowness or use the application during these times.
I notices all the queries reported in ADDM use index hints, and like I said the queries run very fast from a sql prompt.
I am wondering if it is application code that is queuing up reports and queries that are causing the delay, internet issues, database waits or a combination of all - but I would like to be able to point out where the problem "most likely" is coming from.
What and where else should I be looking for? Next steps?
thanks in advance.
(note: the SQL in sql 5gr56zs9taqs6 regarding redo is not usually in the ADDM report)