Hello,
i have performance problems with a query that is fast when run in SqlDeveloper / SqlPlus but takes 6-7 seconds in an interactive report.
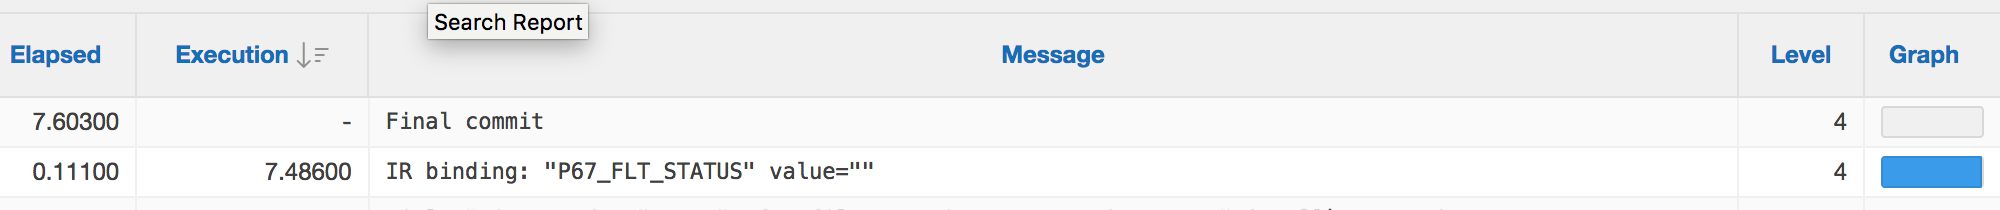
If i enable debug window, i see that 7.4 seconds are taken by IR binding: "APXWS_MAX_ROW_CNT" value="100000", if i clear Max Row Count value , the 7 seconds are taken by "IR binding: P67_FIELD_NAME1"; if i remove that field from the query it is taken by another field used as condition in the query.
How can it be solved?
Query returns 300-400 records and runs fine outside Apex.
Thanks in advance and greetings
Cris