G'day all,
Recently I noticed a performance issue with a plugin that referenced an APEX dictionary table.
One solution was to create a materialised view, but after I asked the question on twitter
"Do you create materialized views (snapshots) of APEX dictionary tables, to help performance of your application?"
Connor McDonald responded with
"That would (in most cases) be somewhat redundant. Trace Apex and you'll find a huge amount of dictionary queries have the RESULT_CACHE hint (which is a "just in time" materialized view anyway). Better option might be to increase result cache pool size"
So I thought I'd share my experience(s), try nut out exactly what's going on.
Performance problems are amplified in our development environment, particularly in the mornings. I think the VM takes a while to wake up and talk to people, like me.
Therefore, I noticed an consistent issue with the use of the dynamic quickpicks plugin.
(I'd like to modify this page to use classic report regions instead, but it highlights this dictionary problem)
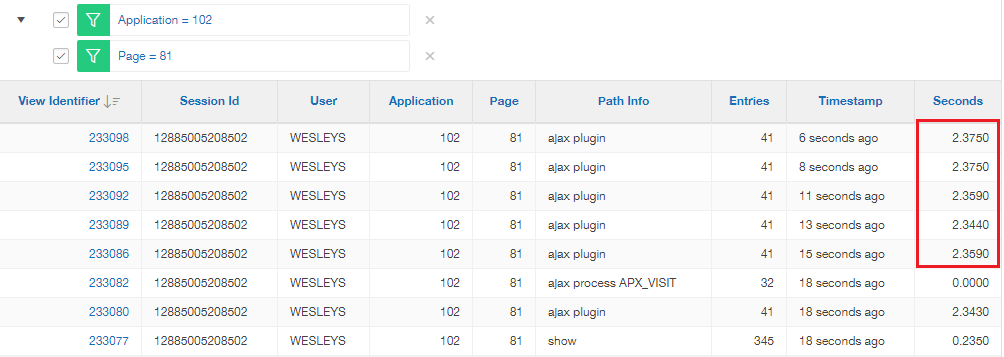
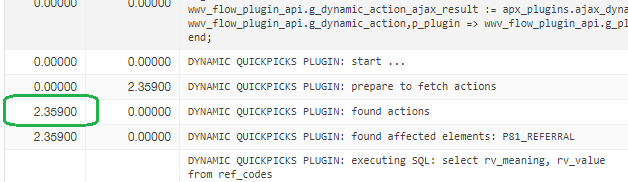
So looking deeper, I found the bottleneck here
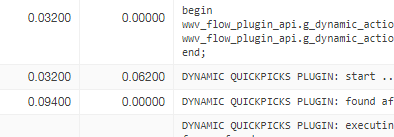
And by consistent, I mean the for the first few times (multiple) it would do this, then not be a problem.
The blip is even noticable in production:
Here is the query I found in the relevant location in the plugin
select affected_elements into l_item_names
from apex\_application\_page\_da\_acts

where application\_id = v('APP\_ID')

and page\_id = v('APP\_PAGE\_ID')

and action\_id = p\_dynamic\_action.id;
Even though I know these particular requests don't ping a table, I tried using explicit PL/SQL package variables instead
select affected_elements into l_item_names
from apex\_application\_page\_da\_acts

where application\_id = apex\_application.g\_flow\_id

and page\_id = apex\_application.g\_flow\_step\_id

and action\_id = p\_dynamic\_action.id;
I also tried scalar subqueries on the v() functions, removing app/page filter and just use action_id, with no affect.
Having previous success with using snapshots on dictionary tables, I created one for apex_application_page_da_acts, placed a unique index on action_id, kept just that as the filter, and I no longer have a performance issue.
The explain plan for the dictionary table looks clean, but large. The explain for my solutions is obviously just a unique index scan. The row count is ~20k (dev) and ~30k (prod).
But I would like to know more about Connor's suggestion.
I have another example. We've had a snapshot on apex_application_pages for years. We use it for menus, validation, lists, conditions, and no doubt other places I forget.
So let's take a simple query, and compare the dictionary query with the snapshot.
select * from apex_application_pages where application_id = p_app_id and page_id = p_page_id;
just a brute execution comparison:
iterations:10000
 7.48 secs (.000748 secs per iteration) -- dictionary (7k rows)

 0.81 secs (.000081 secs per iteration) -- snapshot (selective 2k rows, one unique scan)
This is why we use snapshots. Is there a better way to solve this problem?
We're currently on 5.1.3, on 12.1.
Scott