We have a report:
# of Workers by 4 dimensions: Region, Month, Age Bucket and Gender presented as Pivot table.
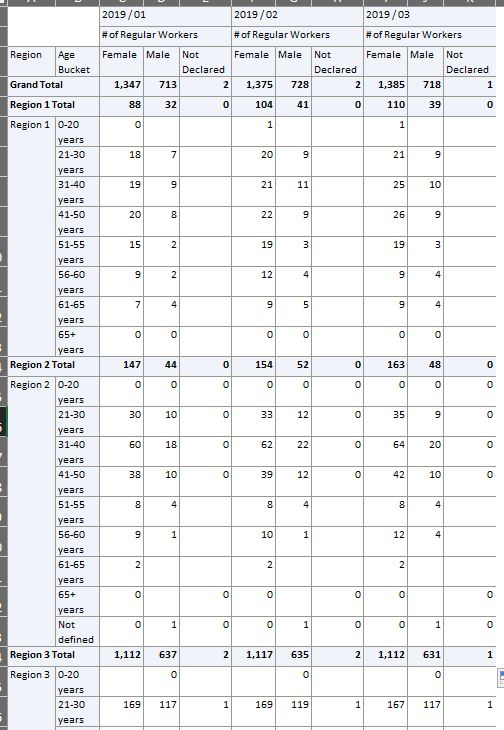
I would like to calculate Percentage share per Gender for each month based on the grand total for each month to present kind of trend change for each month.
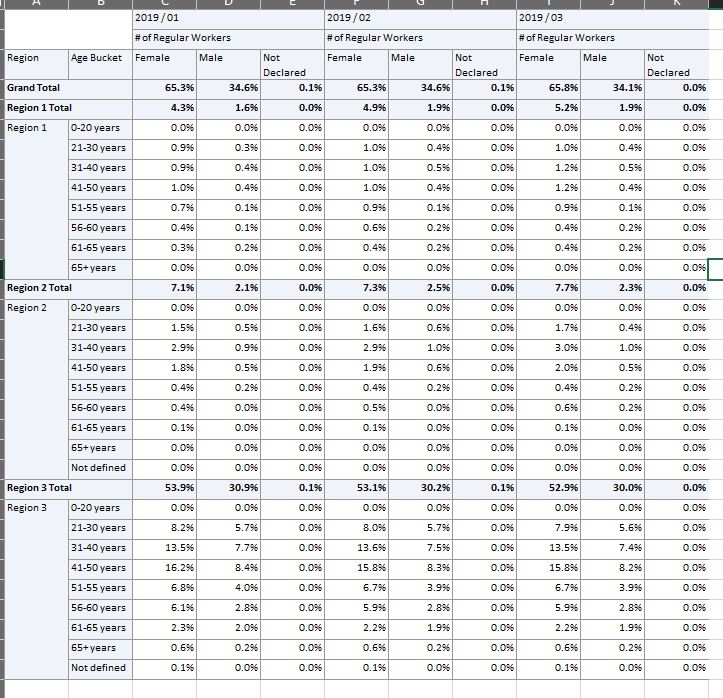
I have tried several options from "Show data as", but none displayed expected results.
Is it possible in OBIEE?