Organization Name (Required - If you are an Oracle Partner, please provide the organization you are logging the idea on behalf of): Dropbox Inc
Description (Required): Require to see both the absolute values($) & percent total(%) in a bar graph.
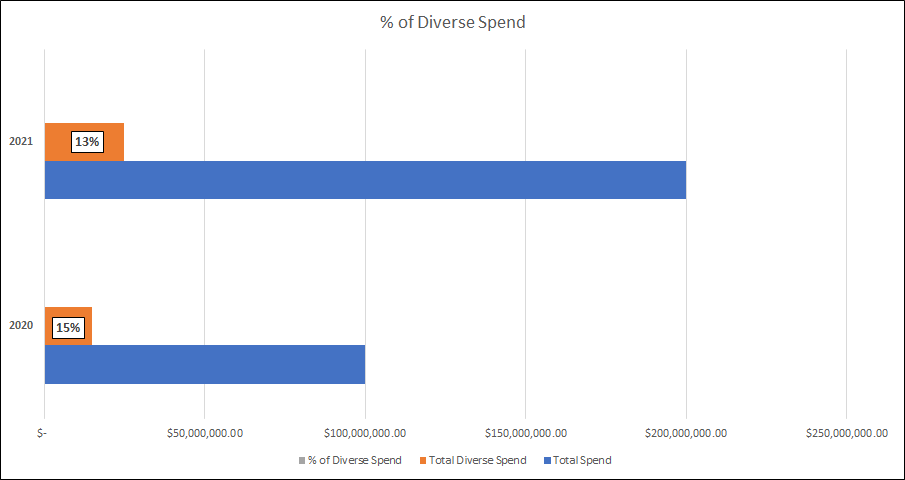
Use Case and Business Need (Required):
In this use case, we use bar graphs to compare the absolute values but also need to populate the % values on the bar. This helps users
- To take screenshots with all the values in one place
- Can present all the required data in one chart
Note: Tooltip here doesn't help as users need to take screenshots with the values on both the bars.
Enhancement Request / Service Request: Enhancement