Hello,
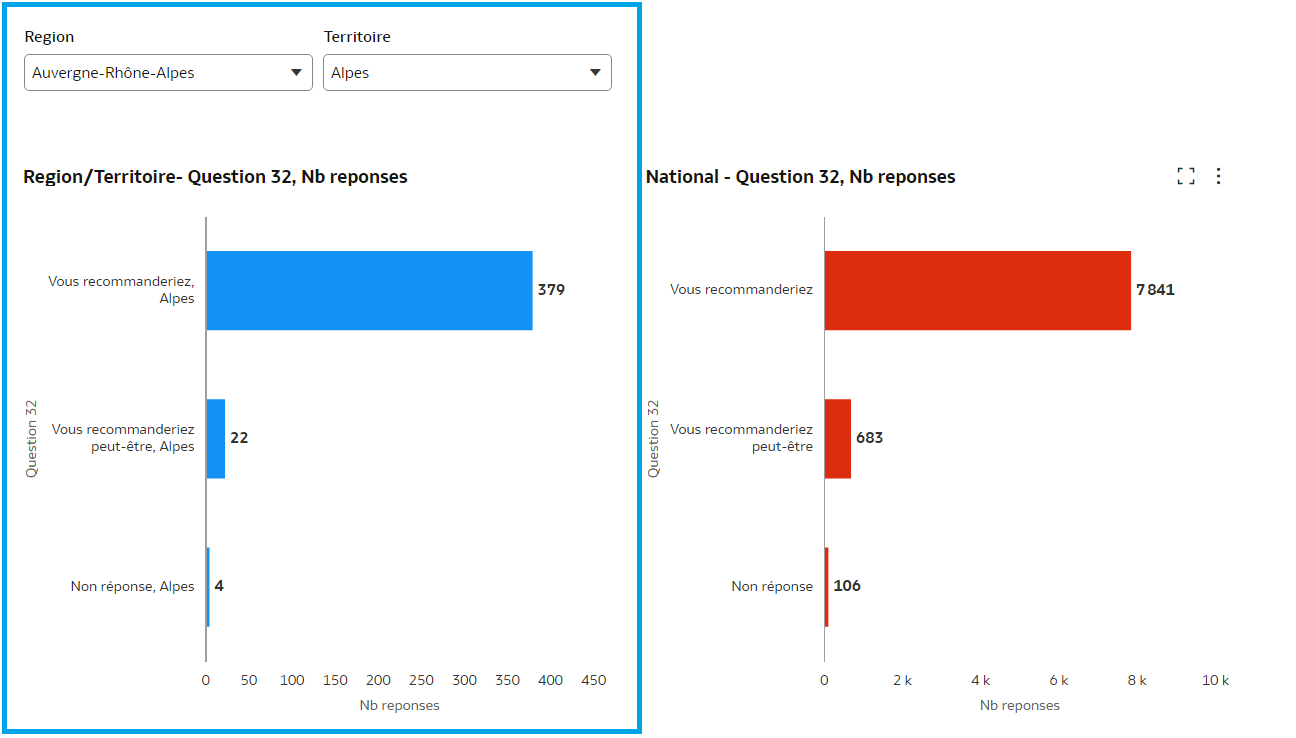
There is a way to display the pourcents of a quiz on the same visualisation (Regional vs National) to avoid to duplicate them? I have many question to represent and putting all side by side it's not very pretty.
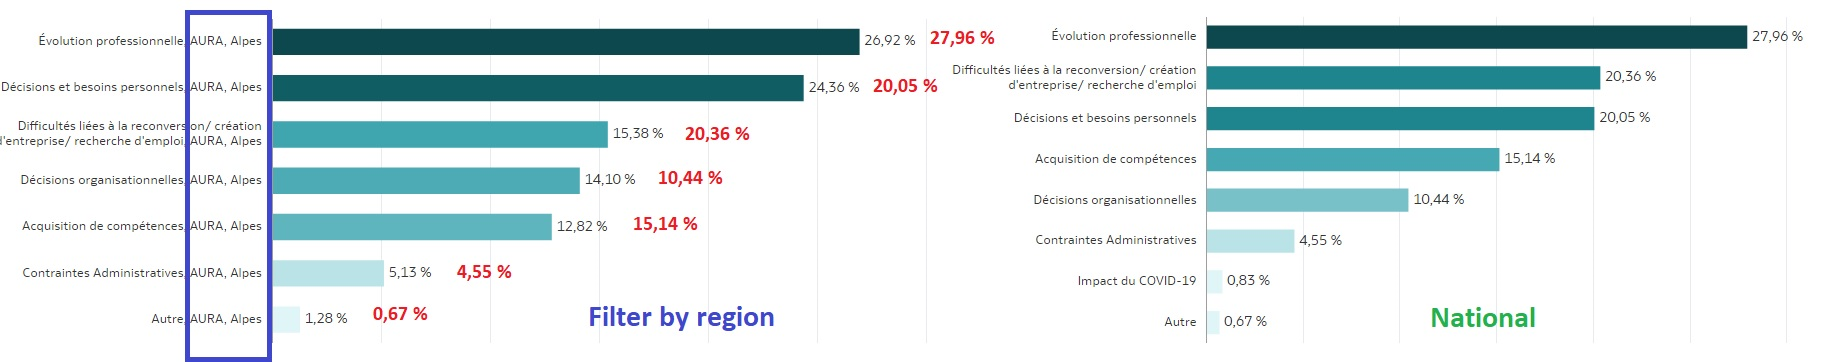
I would like to display the red values on the left graph also. Make a text box for each value (with a filter) it's not an option for me because I can apply a filter and sometimes I don't have all the values on the left side ( 3 bars on a region vs 8 bars on national version). All the static values are shifted each time.
I use 2 differents indicators for each visualisation (from a presentation table and a alias of the same table with different aggregation)
Any suggetions are welcomes: variables, calculations, all that OAC can offer for moment.
Thanks,
Daniel