We have a business requirement to produce a chart which includes a +/- 10% tolerance band around a metric that is depicted by a line on a graph. I see there are some reference line options under Statistics already but no options to base the band on the individual data points for a metric.
For example, if the metric has monthly values of:
Month 1 = 100
Month 2 = 90
Month 3 = 110
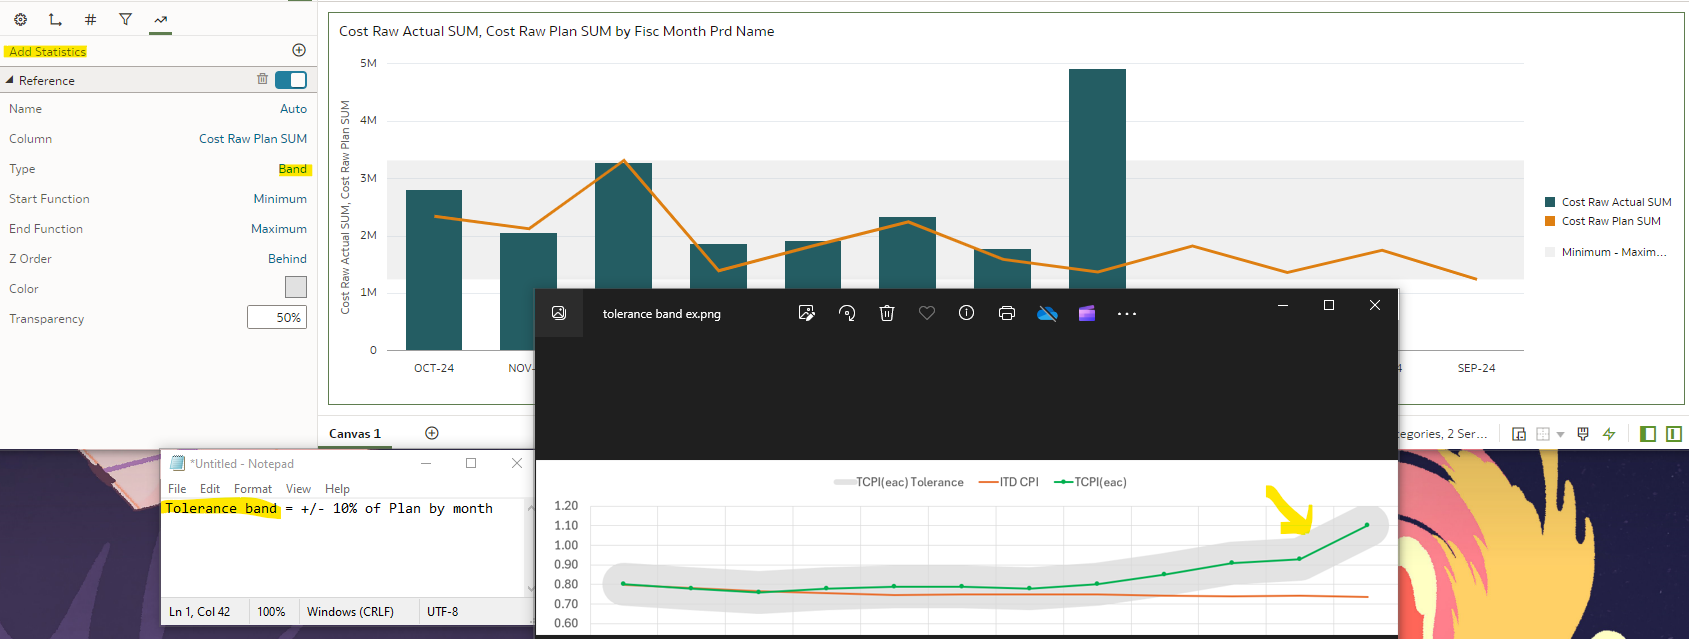
The +/- 10% tolerance band would cover:
Month 1 = 90-110 would be shaded
Month 2 = 81-99 would be shaded
Month 3 = 99-121 would be shaded