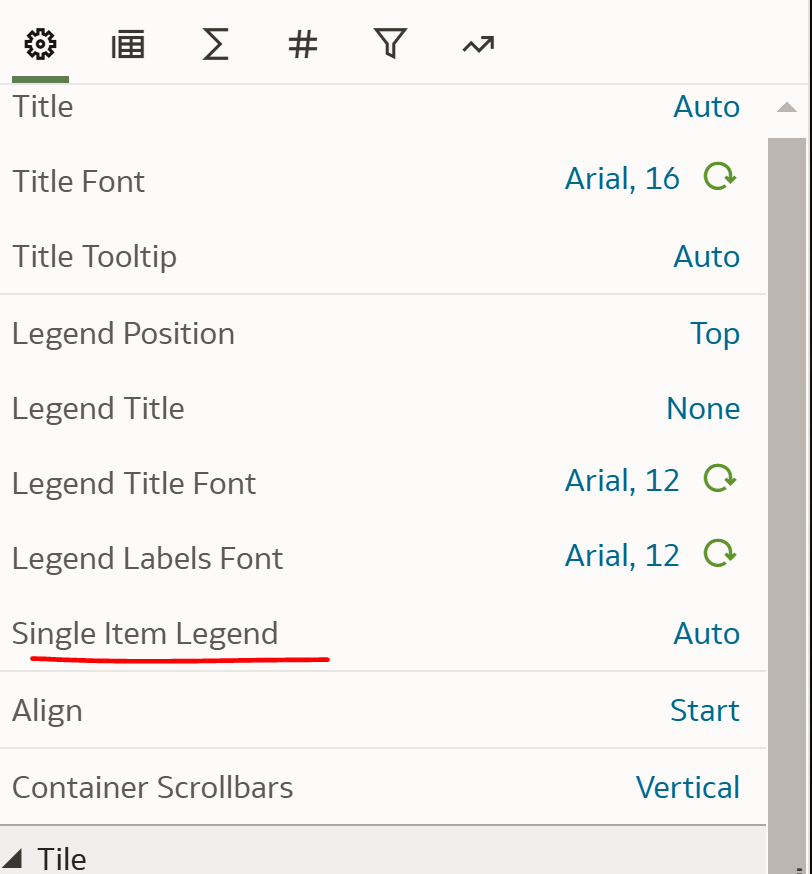
Under general properties for a Viz. This looks like a new feature.
Hi,
I don't know if there is a formal description somewhere.
What that option does is a special flag to handle the case when the legend would contain a single item.
When you have 2+ values in a legend, it does make sense to display it because it shows what is what (by color etc.). But in the case when your legend has a single value, you could consider it's implicit what you are seeing on screen, and therefore you want to say that you in such case you don't want to see a legend. But at the same time you keep the legend if there will be more than 1.
It's really a very specialized setting only for that unique case of a single value in your legend, making it redundant and therefore don't waste space on screen.
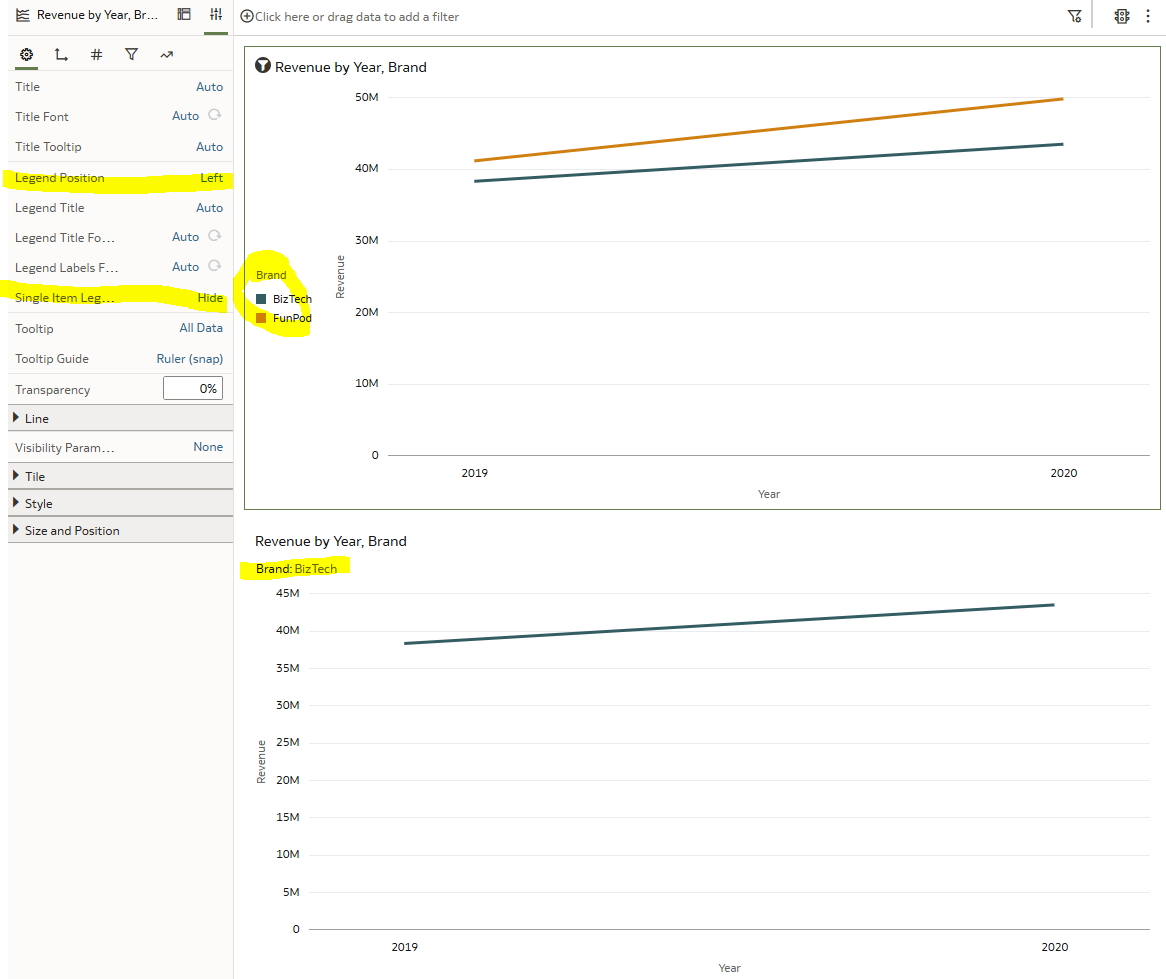
A picture will make it more obvious: 2 visualizations with the same exact settings, the difference is the one on the bottom is filtered for a single "brand".
You see that the first one has the legend, because it has 2 items. While the second visualization, because of the filter, has a single item in the legend. In that case the "Single Item Legend = Hide" override the "Legend Position = Left".
This example is just an illustration of what it is. In a real case I imagine the filters to not be set at the visualization level, but being filters the user can set in the filter bar of the canvas, or by using a dashboard filters visualization inside the canvas itself.
@Avinash Krishnaram-Oracle
About Visualization Properties
Where AI meets business outcomes Oracle AI World brings the Oracle community together to explore how AI and other technology innovations are driving real business outcomes across industries. Discover what’s new through: Mainstage keynotes to hear the latest directly from Oracle leadership Product demonstrations Customer…
I tried the following expression and it blows up when I select more that one value in the list see image
We are using Oracle Analytics Server 2026 with WebLogic Server 14.1.2. Our Account Statement report is accessed through '/xmlpserver'. We need to capture the following details in the OAS/Publisher log files whenever a user runs the report: Username Report name and path Report execution timestamp Account Number From Date To…
We need to download a report with the order number as the file name. In the main report, we have a data action (hyperlink) on each order number. When we click an order number, the linked report is downloaded with the corresponding order details. Currently, the file is downloaded using the report name. We need to download…
Hi all I work in UK healthcare across 30 hospitals nationwide, and we're currently reviewing our Oracle estate and roadmap. Part of that is deciding whether to make a case for investing further in Oracle Analytics Cloud for workforce reporting, or whether OTBI and our existing tools are enough for now. Our HR data sits in…