Hi team,
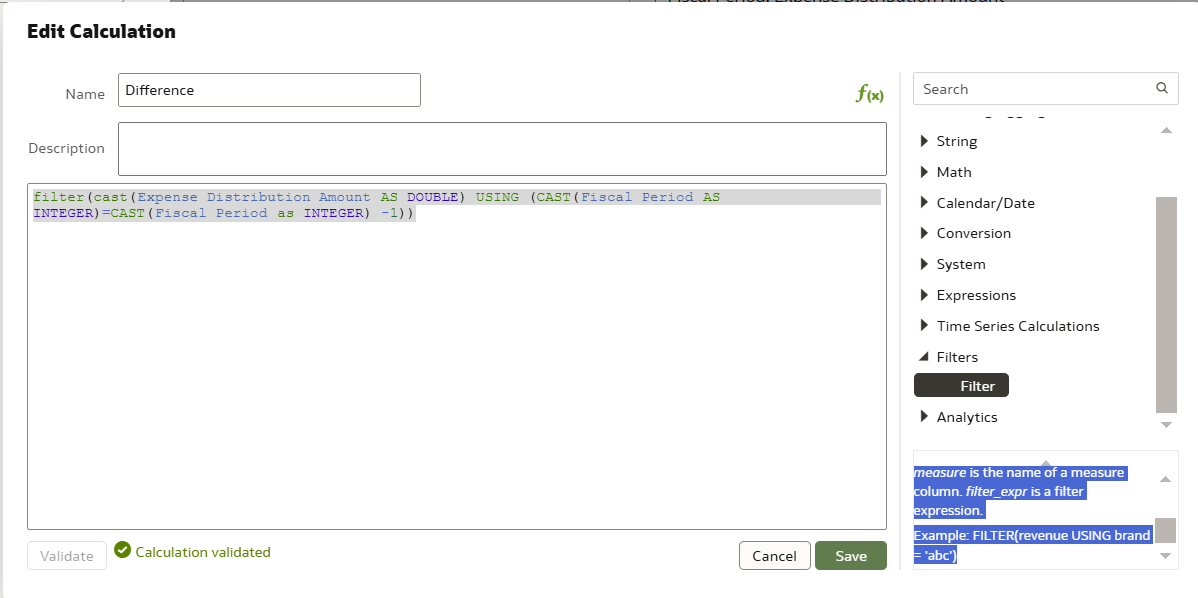
Is there a function in OAC/OAS that can be used to dynamically calculate values inside a table visualization? I’m trying to calculate the % difference and the difference from the previous year for the data in my visualization (please refer to the attached screenshots for more context). Is there something similar to Tableaus LOOKUP function in OAC that can help me with this?
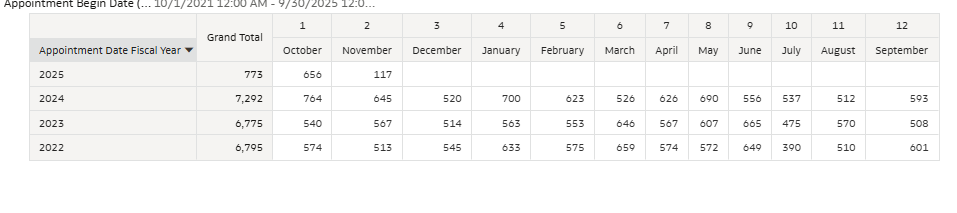
My visual in OAC:
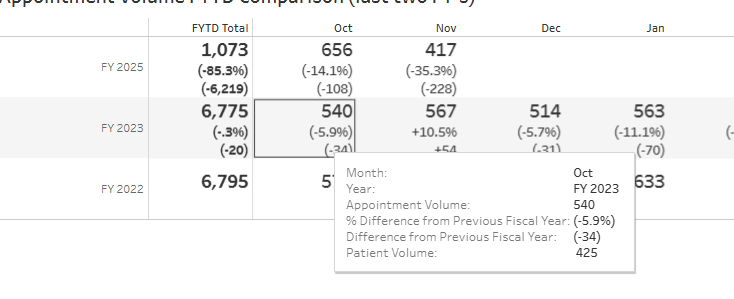
Example visual I am trying to replicate:


![Photo of [Deleted User]](https://us.v-cdn.net/6037859/uploads/defaultavatar/nT2GKTLRQJ3P1.jpg)