I am trying to create a dashboard where I can use a filter to hide/show certain visuals, I have found this video which explains how to set up the parameters however I am not able to put visualisations on top of each other like the video shows at 2:20.
Is there a setting I need to enable to be able to do this?
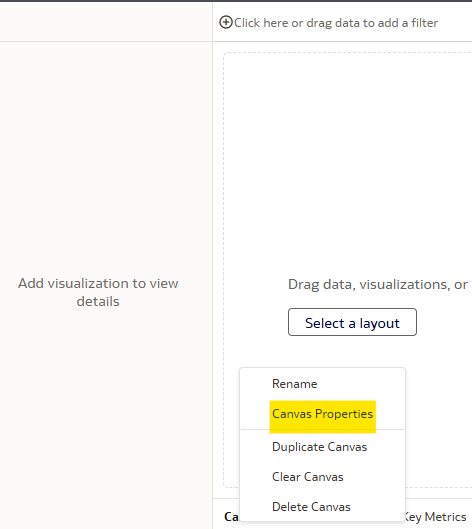
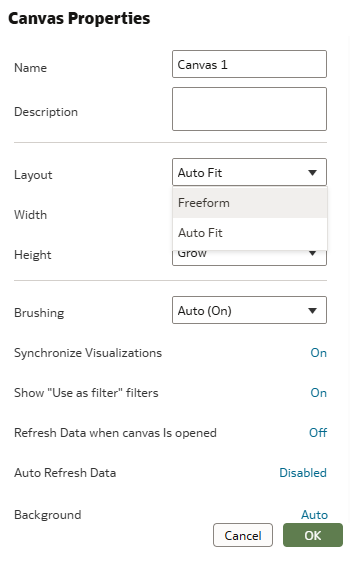
Welcome to the community, @User_GUABF ! You are referring to the Freeform Layout functionality. Canvases default to Auto Fit Layout, but you should have the capability to do change it. To do so:
Here's some documentation about the features within this area:
Very helpful information.
Thanks for sharing @Jamie Anderson-Oracle.