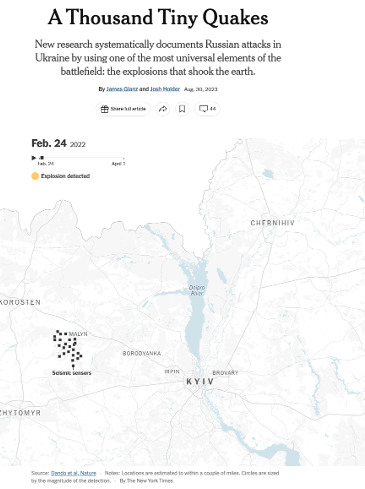
As of Sep 2025, users can only put a title to a data visualization. This is ok but not best in class. Most of top data visualizations, like the ones from New York Times are having a subtitle or description to their data visualization (see figure 2.)
We can achieve something similar by adding 2 text data visualization type per viz but it's multiplying the number of viz by 3 in a dashboard so it's not practical.
My proposal is to allow users to add a subtitle or description inside the visualization. (see figure 1.). It has been done in Auto Insights and it's looking perfect. We need it in DV.
Figure 1.
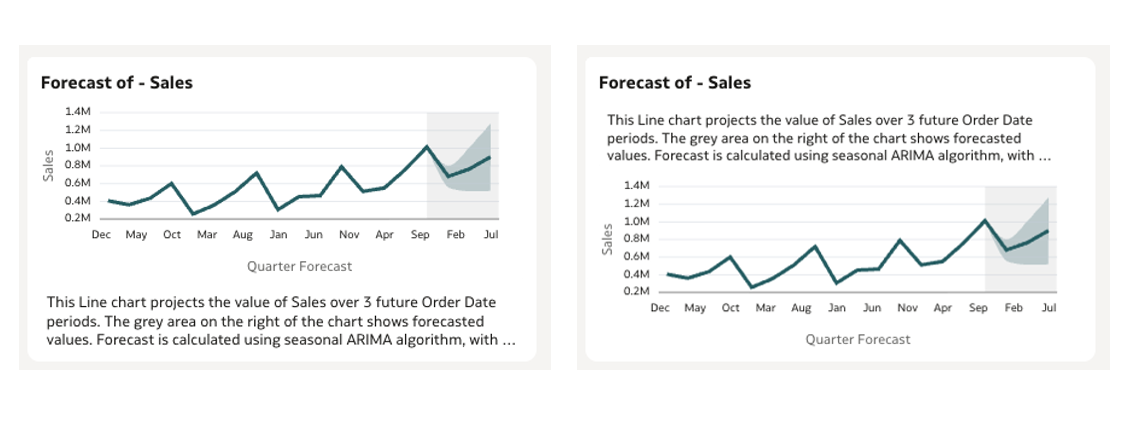
Figure 2.