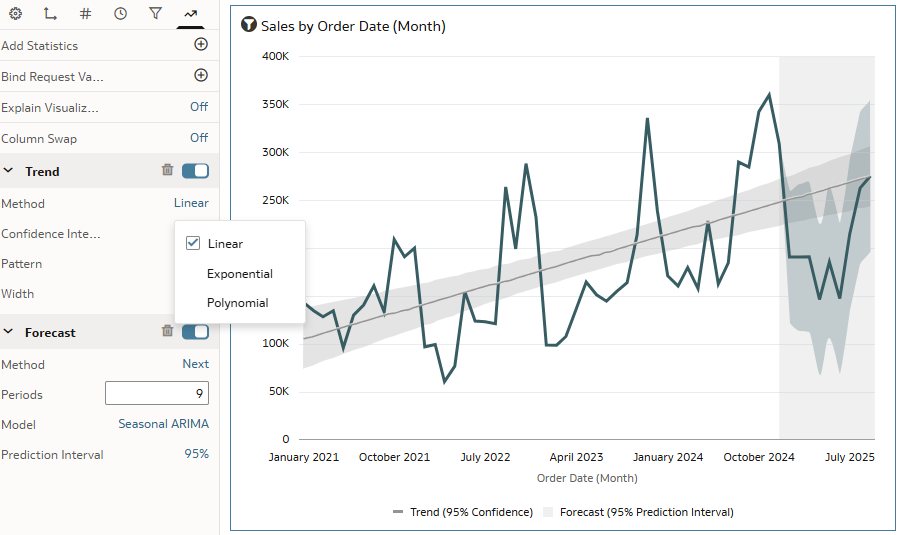
Added linear regressions in the Analysis section, then forecast for certain visualizations such as curves (see the example on the right). In addition to the forecasts already present such as ARIMA, SARIMA, ETS, etc.
Yes this would be useful and some additional regression lines in other visualizations would also be helpful, along with an AB line
Thanks @Thomas HYRIEN and @Brendan T
currently using right-click trendline, you can add a linear(regression)/poly/expo trendline on the viz directly, see below, that should already help with the initial question. As for slope and intercept (was that your question ?) these will are provided when the trendline is built on a scatter plot. But when the trendline is using date, X is then normalized to a sequential number and A&B become conventions (funtionally meaningless). Let me know if this does not answer your question
Thanks
Thanks Philippe
Hi,
Thanks,
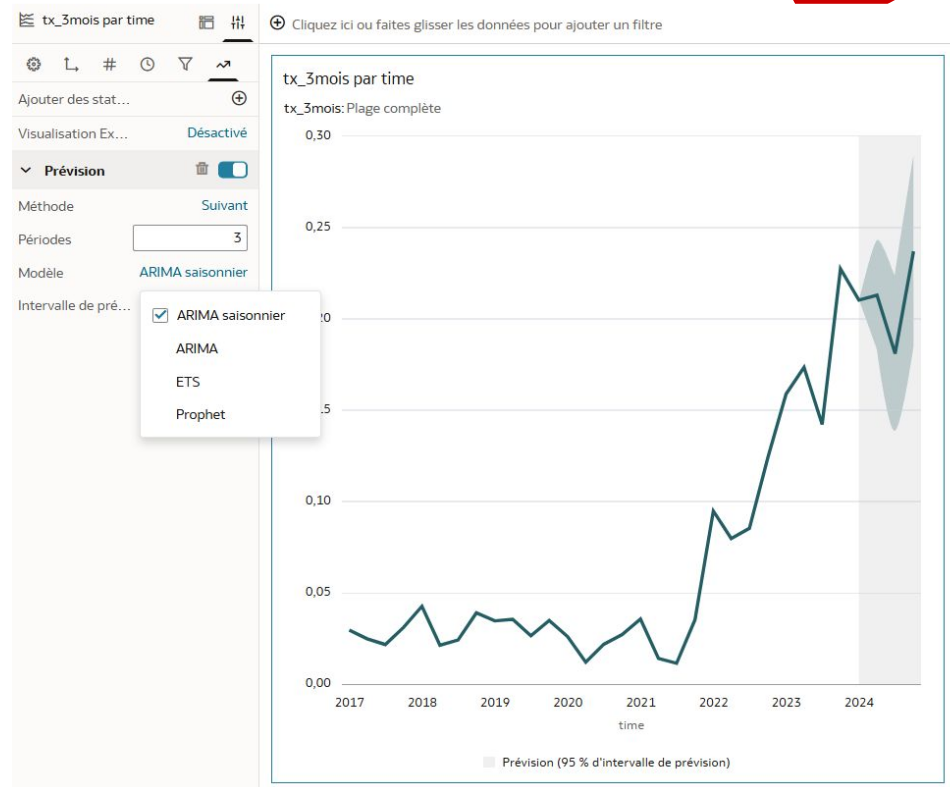
We would like some additional forecast models in the list in addition to ARIMA, SARIMA, ETS, etc.
While additional algorithms are being requested there is a fuller list of what could be added (some already there)
Autoregression (AR): Predicts future values based on past values of the same series.