Please enhance the Grid Heat Map visualization to support the same data label customization options available in other visualizations
For example: In the Treemap visualization, data labels can be configured to show value/percent/label and support formatting controls such as font selection, bold, italic, and underline. In Grid Heat Map, the data label font and weight are currently fixed.
Requested change: Add data label content options (value, percent, label) and formatting controls (font size, bold, italic, underline) to Grid Heat Map to match Treemap capabilities.
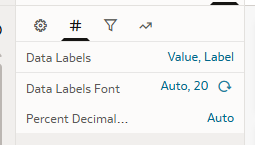
Current Treemap Feature:
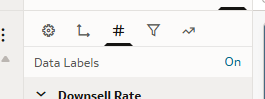
Current Grid Heat Map Feature: