1. Which dataset did you use
I used a Life Science Pharmacovigilance Case Reporting dataset, which contains information related to patient case reports including demographics, medical history, adverse events, product information, and reporting details. The dataset includes attributes such as patient age, gender, country of incidence, medical history PT (Preferred Term), event seriousness, product/batch information, reporter type, and case timelines.
2. How did you analyze or prepare the data?
I analyzed the dataset using Oracle Analytics Cloud by applying filtering, aggregation, and calculated metrics to derive meaningful insights. Key data preparation steps included:
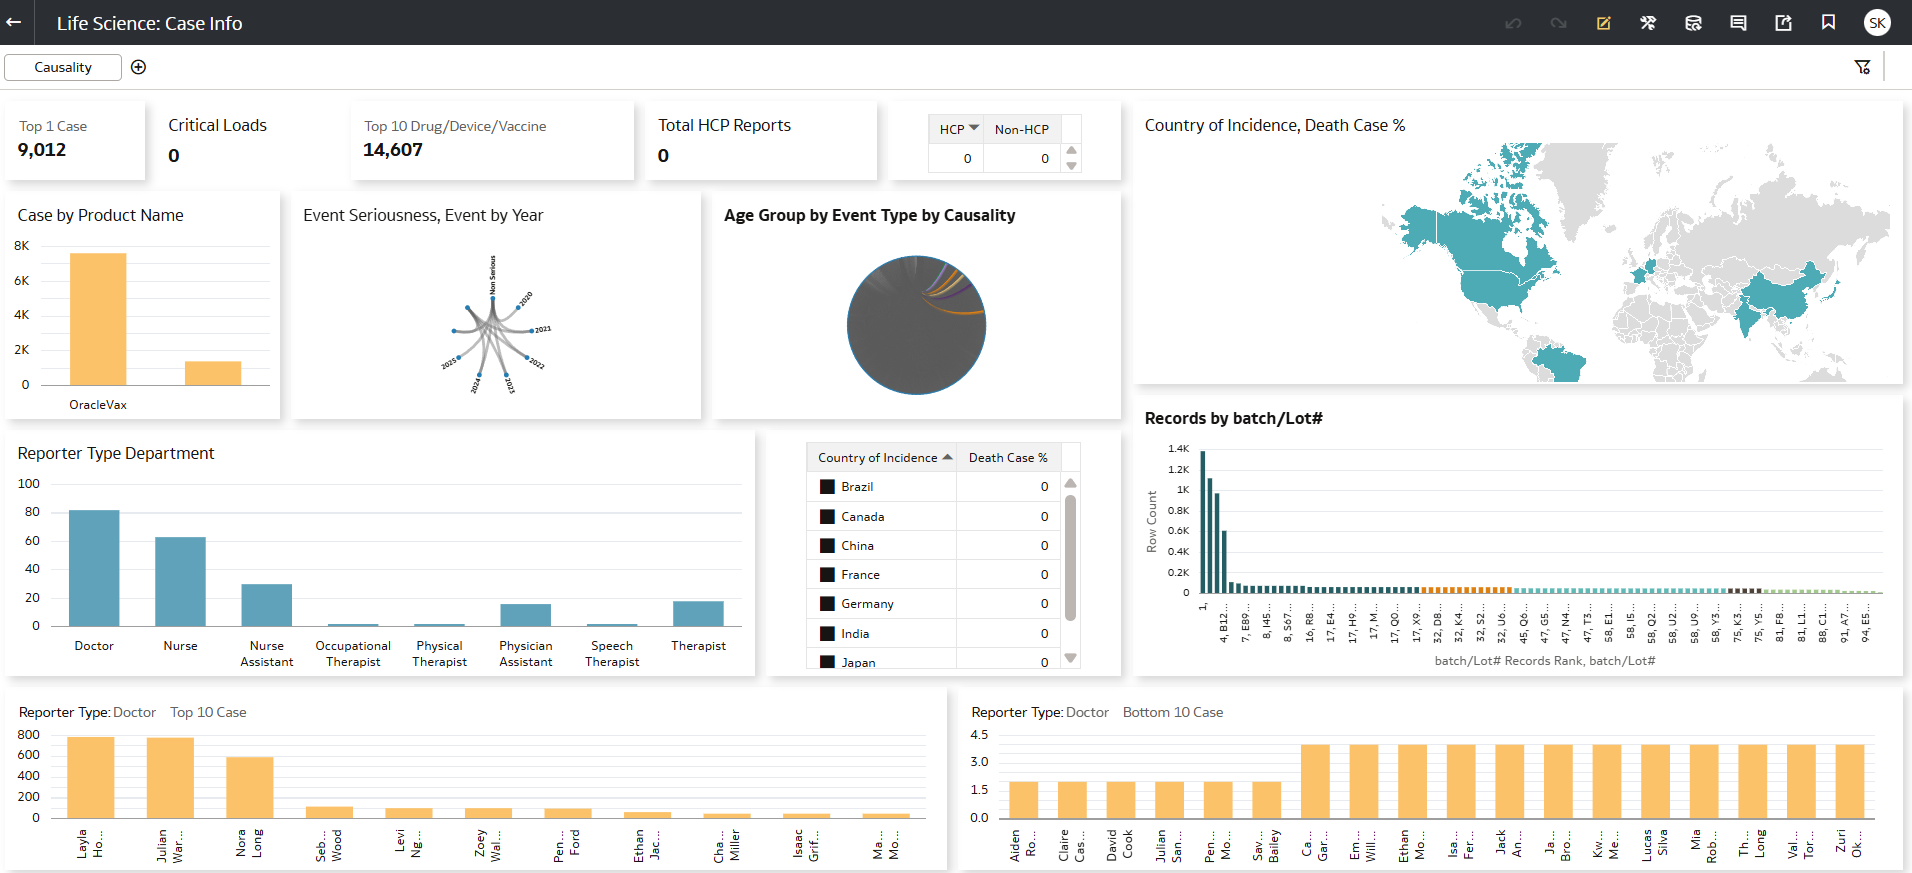
- Filtering case records by seriousness, causality, and reporting year
- Aggregating case counts using Distinct Case ID
- Segmenting patients by age groups and gender distribution
- Creating calculated measures for:
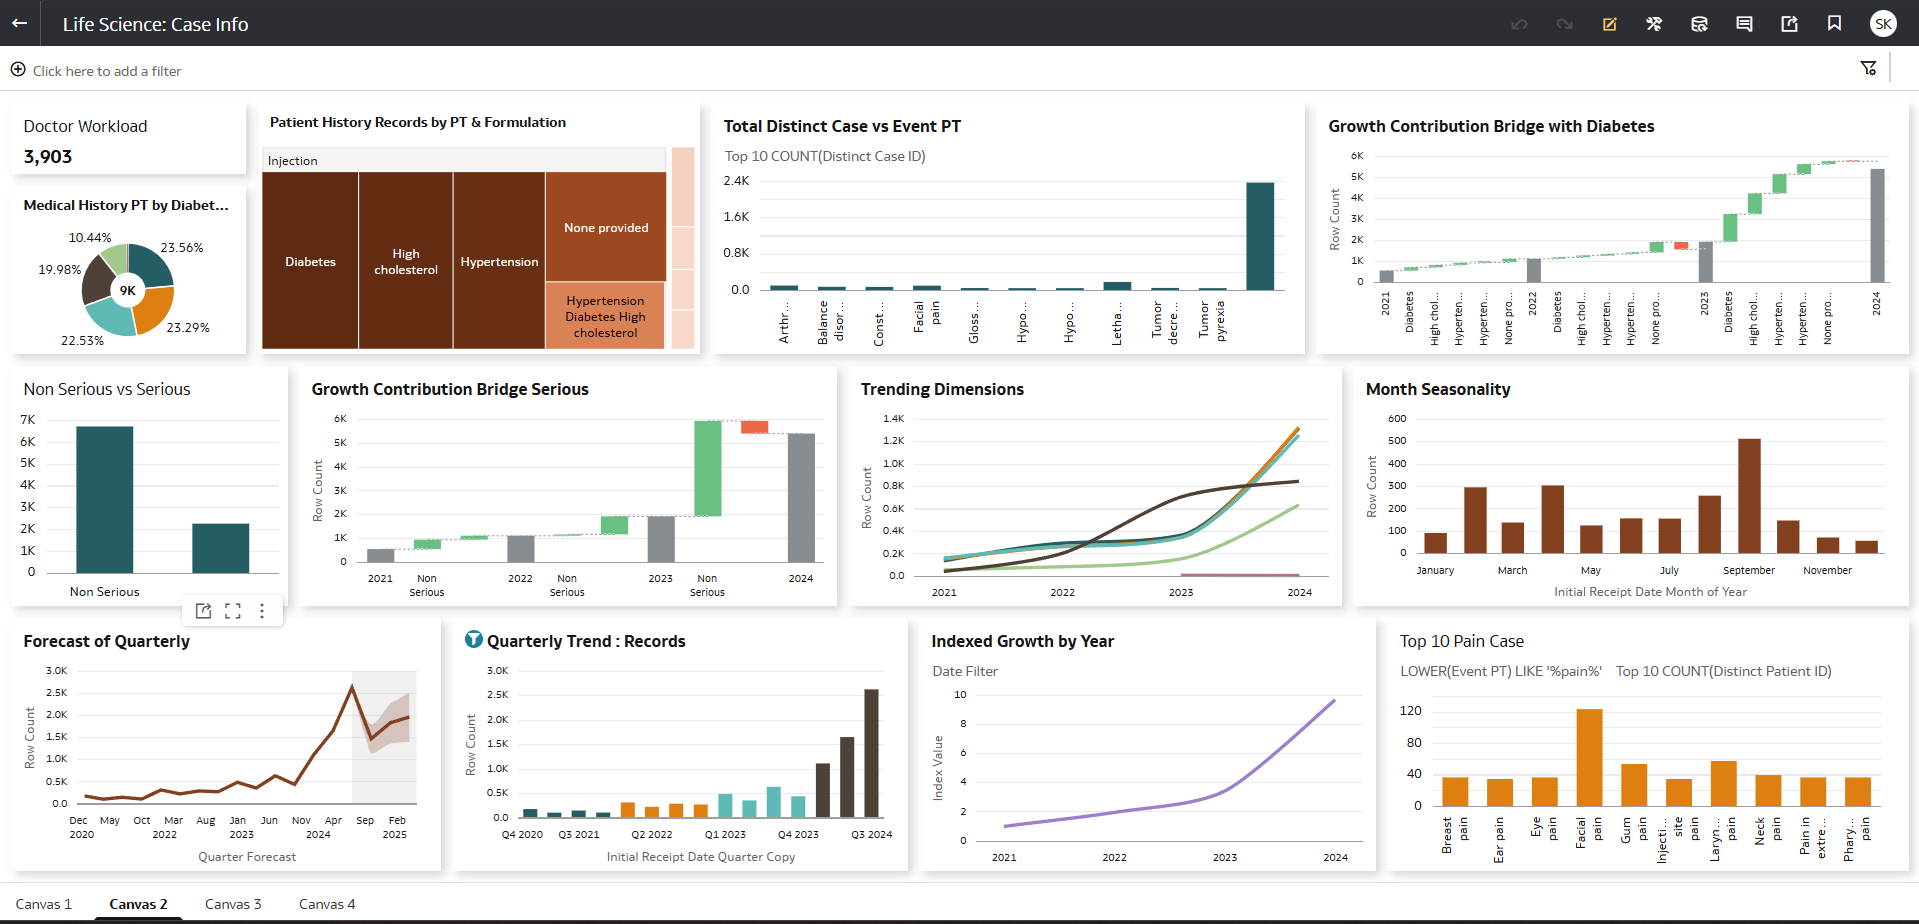
- Serious vs Non-Serious case distribution
- Medical history contribution (Diabetes, Hypertension, Cholesterol)
- Country-level incidence analysis
- Quarterly and yearly case reporting trends
- Case growth contribution across years
I also analyzed product-level and batch-level reporting patterns and created time-based trend analyses for forecasting case reports.
3. Who is the intended audience for your visualization?
The intended audience includes:
- Pharmacovigilance Analysts
- Clinical Safety Teams
- Healthcare Data Analysts
- Regulatory Authorities
- Life Science Research Teams
4. What is your visualization about, and what question or problem does it address?
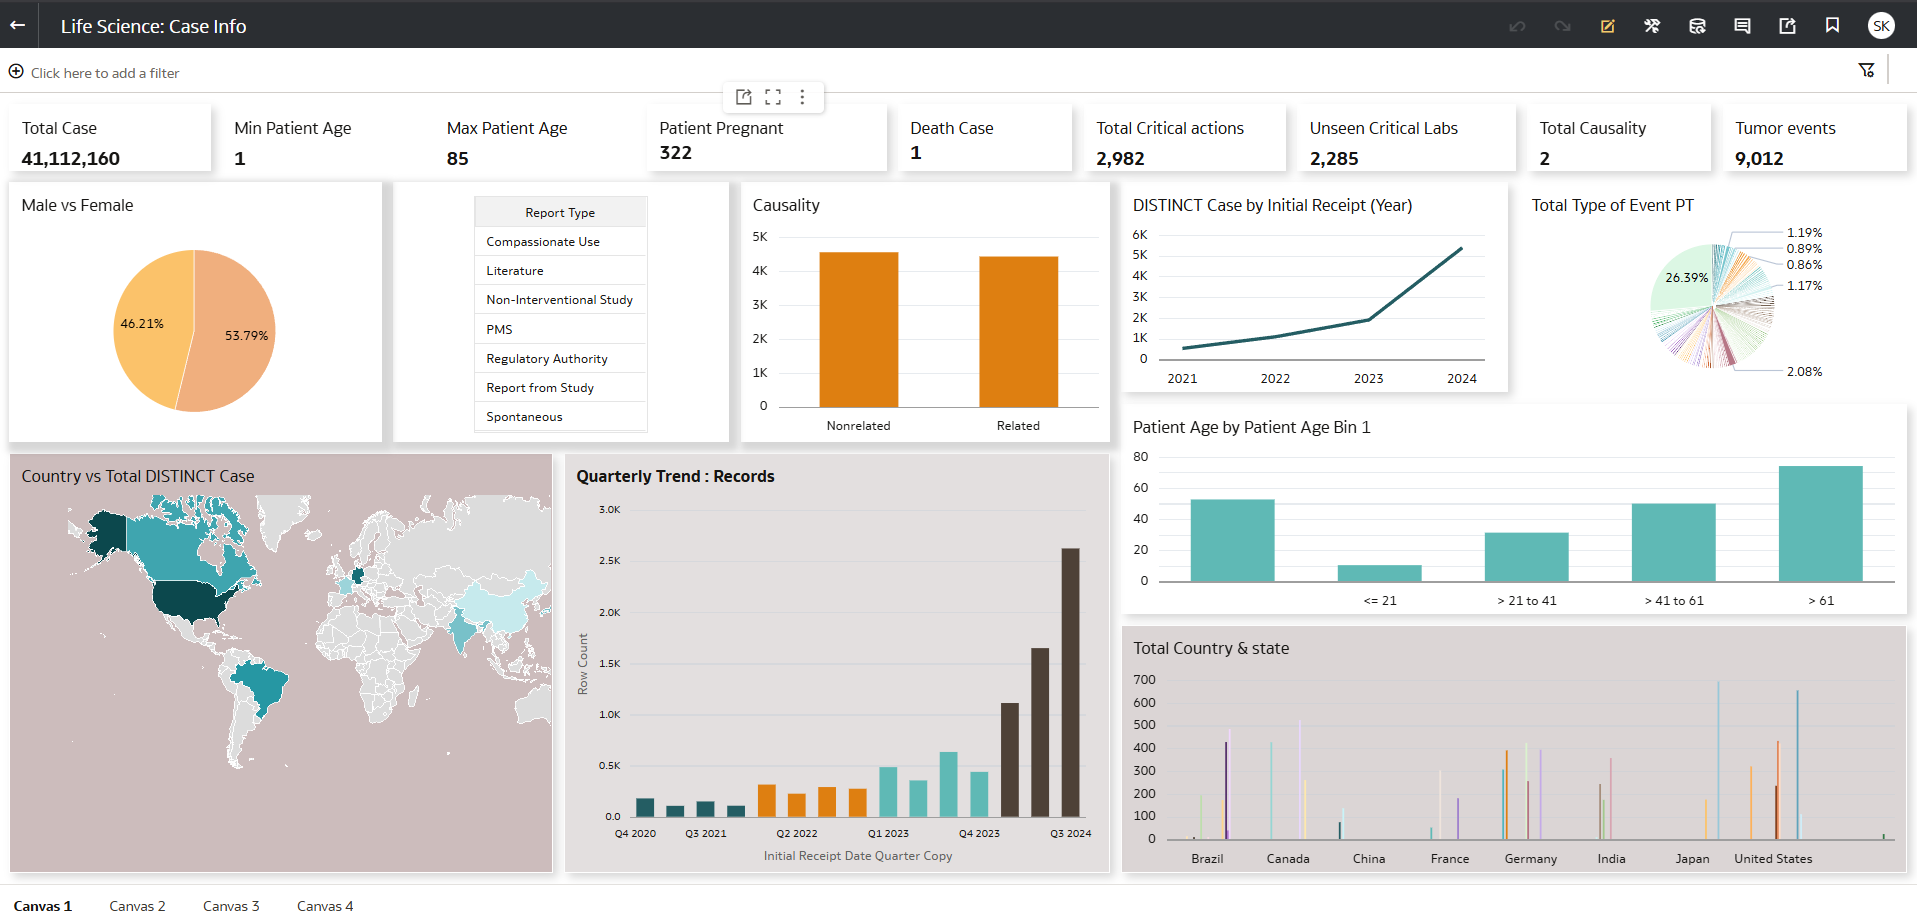
The visualization focuses on pharmacovigilance monitoring and patient safety analytics. It helps analyze adverse event reports, patient medical history patterns, and reporting trends to support healthcare monitoring and regulatory decisions.
Key questions addressed include:
- What is the distribution of serious vs non-serious adverse events?
- Which medical history conditions appear most frequently in patient reports?
- How are cases distributed across different countries?
- Which products or batches have the highest number of reported cases?
- How have case reports grown over time?
- What seasonal patterns exist in case reporting?
The dashboard helps identify potential safety signals, reporting trends, and patient risk factors.
5. Did you use any Oracle Analytics AI features when building your visualization? If so, please describe how they were used.
Yes, I used several Oracle Analytics AI features, including:
- Explain to understand the key drivers behind case growth and event distribution
- Auto Insights to detect patterns in reporting trends and patient demographics
- AI-assisted visualization suggestions to select appropriate charts for geographic distribution, growth contribution analysis, and case forecasting
These features helped highlight important trends and improve the interpretability of the dashboard.
6. Did you upload your visualization image and DVA file?
Yes, the visualization images and the corresponding Oracle Analytics project file were uploaded.


