Organization Name
U.S. Sentencing Commission (USSC)
Description
We need a mechanism to control the number of decimal places displayed on a DV chart.
Use Case and Business Need
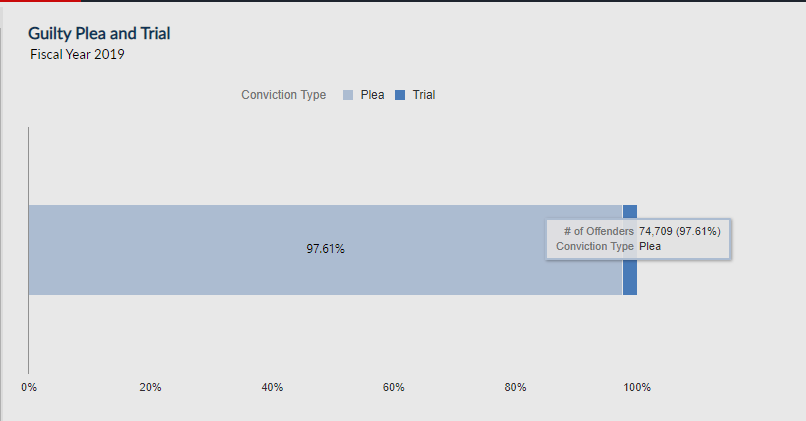
Pie charts or 100% stack charts calculate & show the percentage of the data with two decimal places. We need the ability to display the values with 1 decimal place in order to lower the precision of the values displayed in the chart such that when the values are summed they will match the total number. As a result of having 2 decimal places, the sum of all the values doesn't match the total. These pie charts are part of the public facing dashboard and all the figures published by our client must be displayed with one decimal place. Please see attached picture of 100%-stack-bar-chart which show "Number of Offenders" who plead guilty versus went to trial. The percentage 97.61% is calculated/generated by data visualization based on "Number of Offenders" and has two decimal place. The client must publish values with one decimal place, so we require a way to customize the decimal place in percentages calculated by Data visualization (DV)/OBIEE/OAS.
More details
Our client publishes their data in a paper book called the "source-book" every year. All their paper publications use one decimal place for all the percentage data therefore the on-line/digital applications must adhere to that standard. This is why we need the ability to control the number of decimal places/precision in percentage calculated by Data Visualization (DV)/OAS.
Original Idea Number: 7a335d7dc1