Categories
- All Categories
- Oracle Analytics and AI Learning Hub
- 54 Oracle Analytics and AI Sharing Center
- 26 Oracle Analytics and AI Lounge
- 312 Oracle Analytics and AI News
- 57 Oracle Analytics and AI Videos
- 16.4K Oracle Analytics and AI Forums
- 6.7K Oracle Analytics and AI Labs
- Oracle Analytics and AI User Groups
- 117 Oracle Analytics and AI Trainings
- 24 Oracle Analytics and AI Challenge
- Find Partners
- For Partners
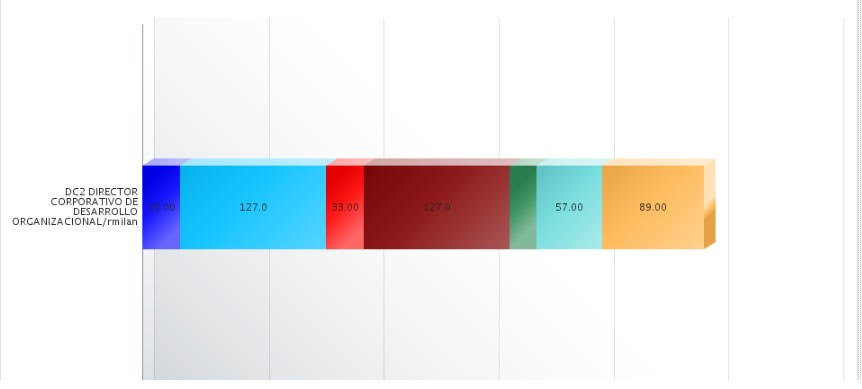
Change the color of the bars in the graphics of BI Publisher report

Description
We suggest that in the graphics of BI Publisher report, were more than five color for the bars.
Use Case and Business Need
The issue is that we have a limitation, in the report we can only change the color of 5 bars and we need more than five bars.
Oracle confirmed us that, at this time, it is not possible to have more than 5 colors/series.
There´s an enhancement request already logged like a bug in My Oracle Support: ENH 25942172 - CHART PLOT AREA MORE THAN 5 SERIES IN CHART. We would like to relate this SR with the ENH 25942172 for consideration and review by Development for a future release.
BUSSINESS NEED: The change of colors is really important because our graphics have institutional colors that were defined by manager’s company and it’s a resource that shows the results in all graphics company.
The impact is that, in this case, has become a problem, due to the need of the Company. We’re detained in the execution of tables and graphs in the BI, and that´s the most important reason we require to enable more than five colors of the bars.
The positive effect of this enhacement request will increase the appearence results of the graphics, because it will be visually attractive and the results could be identified in a better and easy way.
Original Idea Number: bd66ecbac2
Comments
-
Our client also has this need.
0