Categories
- All Categories
- Oracle Analytics and AI Learning Hub
- 54 Oracle Analytics and AI Sharing Center
- 26 Oracle Analytics and AI Lounge
- 312 Oracle Analytics and AI News
- 57 Oracle Analytics and AI Videos
- 16.4K Oracle Analytics and AI Forums
- 6.7K Oracle Analytics and AI Labs
- Oracle Analytics and AI User Groups
- 117 Oracle Analytics and AI Trainings
- 24 Oracle Analytics and AI Challenge
- Find Partners
- For Partners
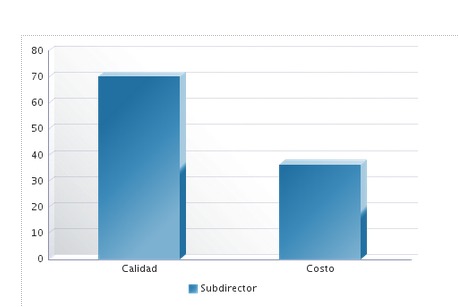
Only one field in a graph, change the color of the bars

Description
By putting only one field in a graph, change the color of the bars
Use Case and Business Need
According to the Graphic Results that are reflected in our company, there´re several results that are distinguished through the differentiation of colors, it´s a basic element considered for decisions that are made for personal development and growth of the company.
That differentiation of colors was determined and operated from directive orders, therefore it´s very important that graphics continue working in this way.
The possitive effects that we could obtain are:
- We could be able to differentiate the desired results.
- The data wil be clear when creating a graphic because it could reflect the information that we would like to show.
- Enable different colors that distinguishes one result or from another.
Oracle told us that there's a bug related with this situation: 25794920 CHANGE COLORS OF BARS IN TOTAL COMPENSATION STATEMENT. We hope this bug could be related with our enhancement request and be considered for future development.
Original Idea Number: 28c1c87238
Comments
-
We have also been requested to change the color of the graph, so this would be incredibly helpful!
0
