Oracle Fusion Data Intelligence

Welcome to the Oracle Analytics Community: Please complete your User Profile and upload your Profile Picture

How to average for a Radar Chart when using Category in FDI?

Accepted answer
33
Views
4
Comments
Scott_Turner_
Scott_Turner_ Rank 5 - Community Champion

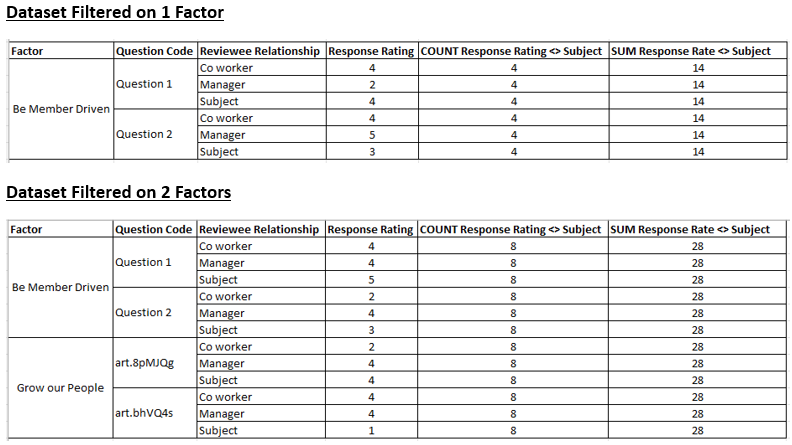
I have a dataset which consist of 6 Factors and each factor has 2 questions, the dataset will vary on how many rows for Reviewees E.g. Sometimes there will be 2 team members respond and sometimes there will 6 team members.

I have written a Calculation which is SUM of Response Rating / COUNT of Response Rating (excluding where Reviewee Relationship = Subject)

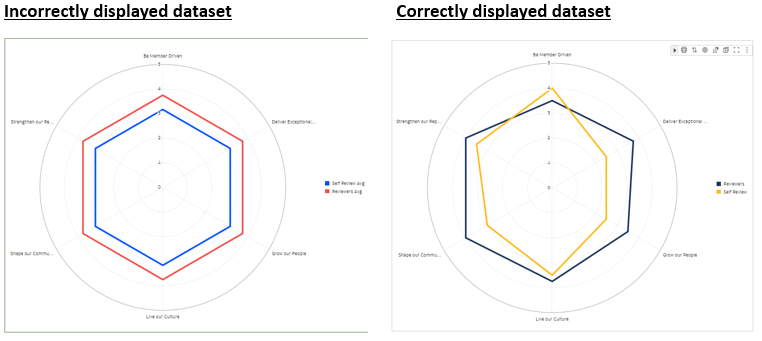
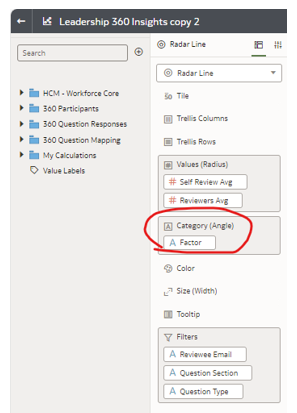
I am trying to visualize the dataset in a Radar Line chart however, when the chart populates it averages Response Rating as a total for the entire dataset instead of by factor. Note: I have Factor added in Category section within FDI.

Any suggestions on how to overcome this? 

Example datasets below:

image.png image.png image.png


Tagged:

Best Answer

Answers

  • Mallikarjuna Kuppauru-Oracle
    Mallikarjuna Kuppauru-Oracle Rank 8 - Analytics Strategist

    Hi @Scott_Turner_

    Seems to be an Grouping issue . Did you verified the sql query generated from workbook so that you can able to get the clear idea on how the tool is calculating?


    Regards,

    Arjun

  • Scott_Turner_
    Scott_Turner_ Rank 5 - Community Champion

    Hi Arjun @Mallikarjuna Kuppauru-Oracle ,

    Thank you for your response, unfortunately I am not sure on how verify the SQL from a workbook in Fusion. I agree with you though on the Grouping, as when I select multiple Factors which is how I am grouping (Category) the values increase based on number of factors selected.

    Any thoughts on how I could achieve a radar chart given the data set?

    Thanks

    Scott

  • Mallikarjuna Kuppauru-Oracle
    Mallikarjuna Kuppauru-Oracle Rank 8 - Analytics Strategist

    Hi @Scott_Turner_

    You can refer below - ( To verify the sql query)

    How To Enable The Developer Option To Analyze Query Performance For A Data Visualization Workbook [Video Content] (Doc ID 2831471.1)

    Regards,

    Arjun