Categories
- All Categories
- Oracle Analytics and AI Learning Hub
- 54 Oracle Analytics and AI Sharing Center
- 26 Oracle Analytics and AI Lounge
- 312 Oracle Analytics and AI News
- 57 Oracle Analytics and AI Videos
- 16.4K Oracle Analytics and AI Forums
- 6.7K Oracle Analytics and AI Labs
- Oracle Analytics and AI User Groups
- 117 Oracle Analytics and AI Trainings
- 24 Oracle Analytics and AI Challenge
- Find Partners
- For Partners
Create the average assignment count on OAC/FAW

Hi,
I have a report to produce using the assignment count KPI for different years.
I've been struggling in FAW to create the calculation that would allow me to display the "average headcount" for a specific year.
For example, for a specific Legal entity, I know that at the end of 2023, there were 71 employees
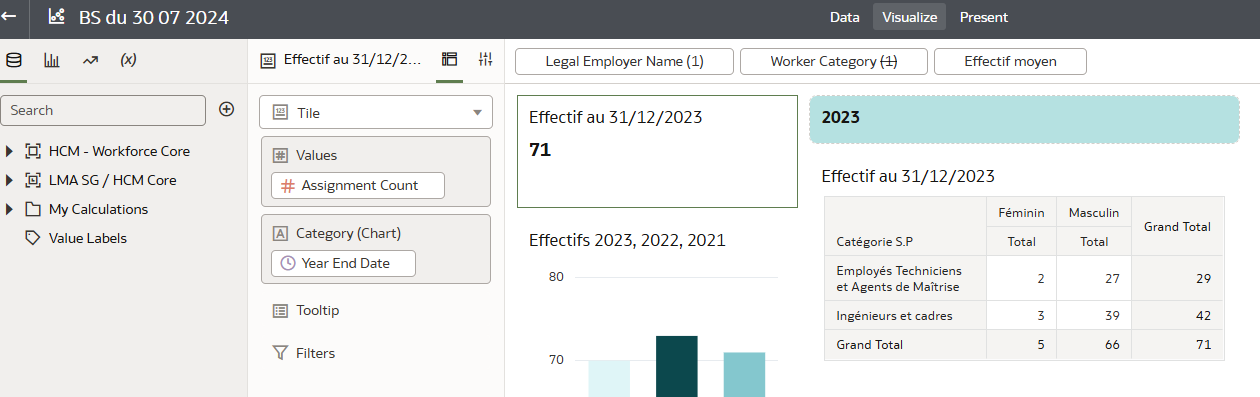
But I'd like to have the average of this number throughout 2023 :
I am supposed to get the result 73. But can't figure out how to get it right…
Could someone help me please ?
Regards,
Lauriane
Answers
-
I can't replicate your example exactly (I don't have access to an FDI environment with data), but this may work:
When your Tile visualization is selected, in the Values panel on the left, try right clicking # Assignment Count. See if you can select Aggregate > Average.You can then adjust the decimal to round up to a whole number in the Properties panel.
Editing to add screenshot: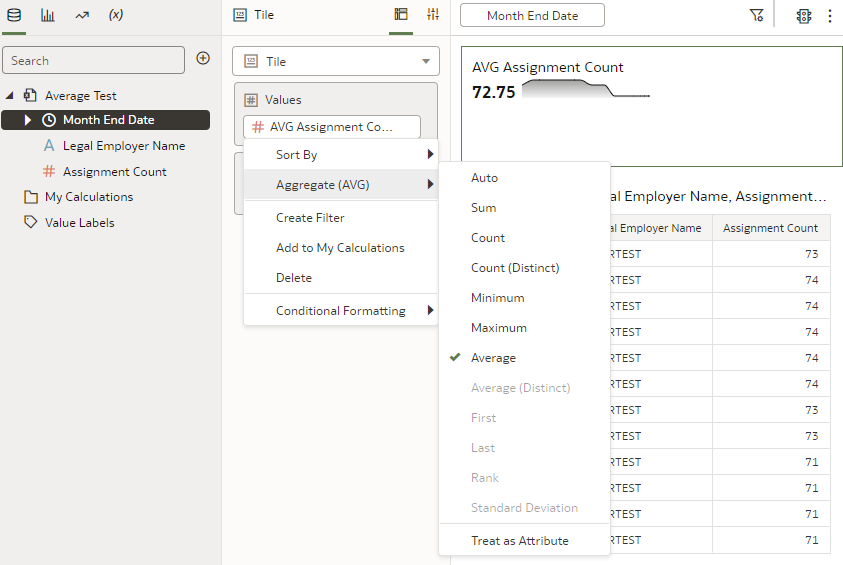 0
0 -
Alternatively, you can use the ago function to calculate previous year values - if that's the general thing you are trying to do. Pls see example below. As an added benefit you can drill down by the time hierarchy and see/compare values across time levels
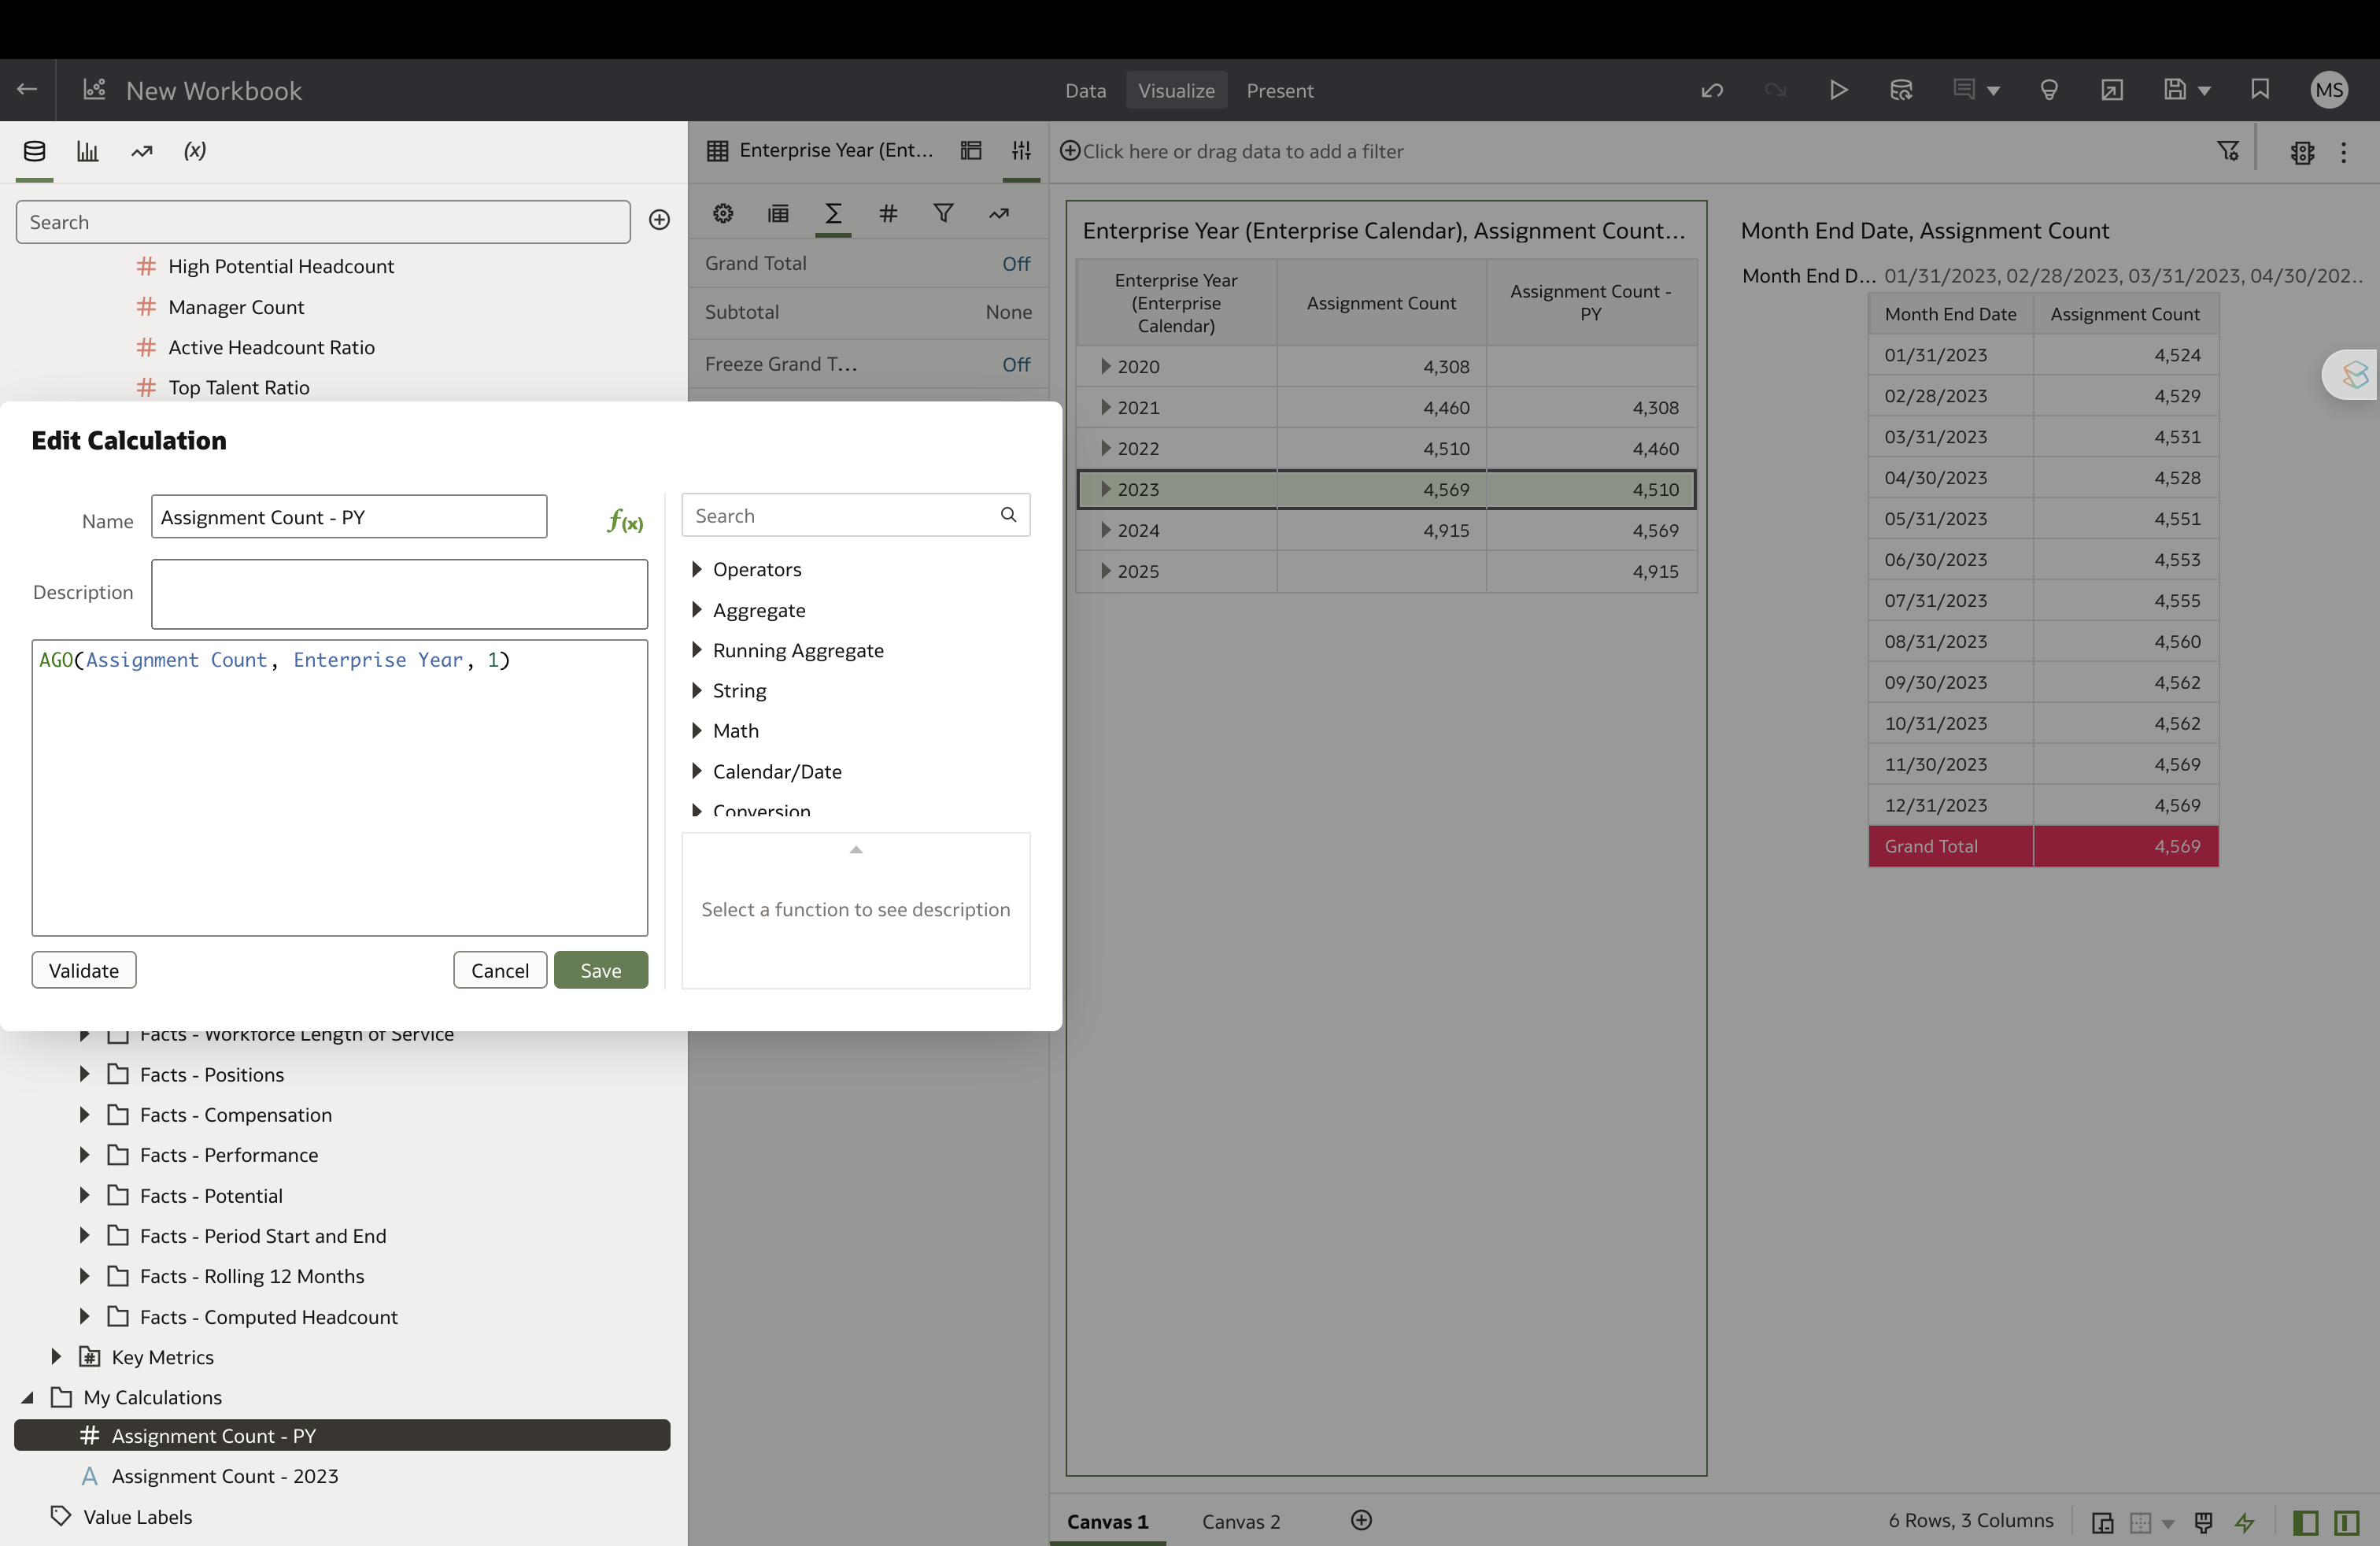
If you just want the value for the year 2023, you could create a custom calculation like below
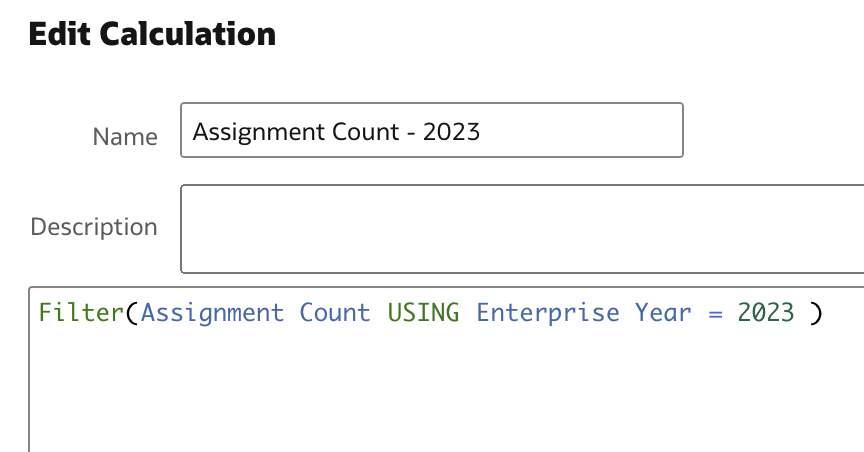
Tagging @Raghavendra Raghunath-Oracle (HCM Analytics PM) for better/alternative solutions
0 -
thanks, Manju @Manjunath Subramanian-Oracle
@Lauriane Massin Whitaker ,fyi
use this attached dv, you can modify the year, LE in the report
Raghu
 0
0 -
Hi guys,
Thank you very much for all the information you provided.
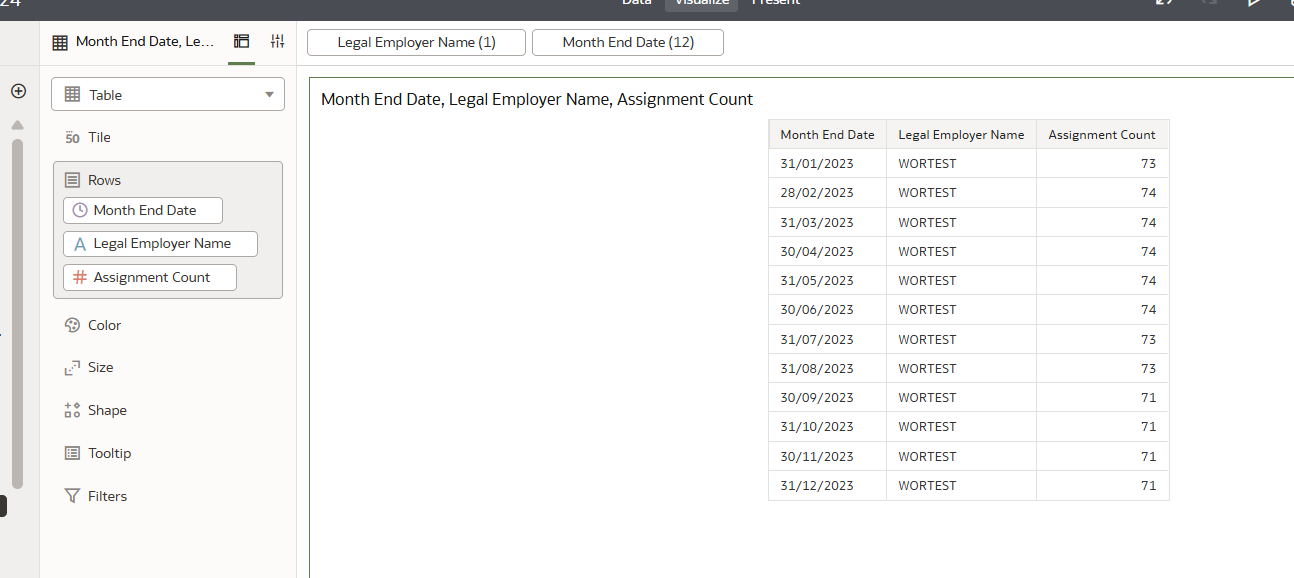
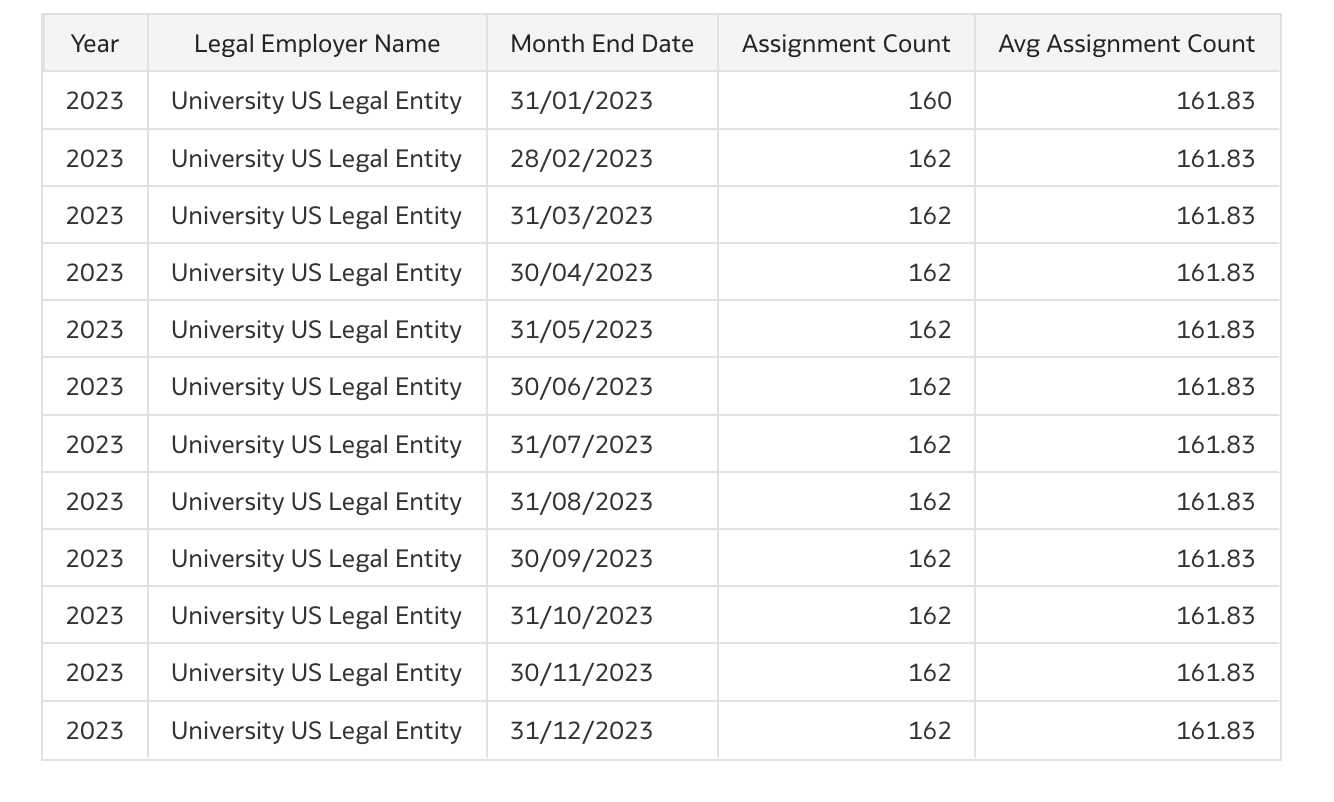
I finally managed to have it right in the report and I selected the month end dates for 2023.
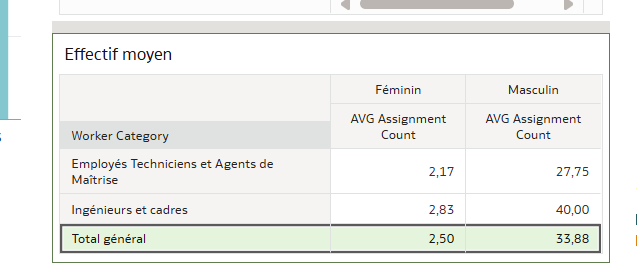
The only pending issue here is that for the sum line, I would have liked to have the sum 2,17 + 2,83 and not the average of the 2 ligne above… any idea of how I can do that ?
Thank you very much.
0 -
Hi Raghavendra Raghunath-Oracle,
I was busy with other reports but I'm coming back to my initial request and I have trouble managing to create my report.
In your calculation, you did : Avg("HCM - Workforce Core"."Facts - Workforce Headcount"."Assignment Count" BY "HCM - Workforce Core"."Time"."Year","HCM - Workforce Core"."Legal Employer"."Legal Employer Name").
But it does not seem to work in my case.
I'm supposed to have the gender in column, the worker category in line, and have the average assignment for these 2 indicators for 2024.
The average for the months below is ok :
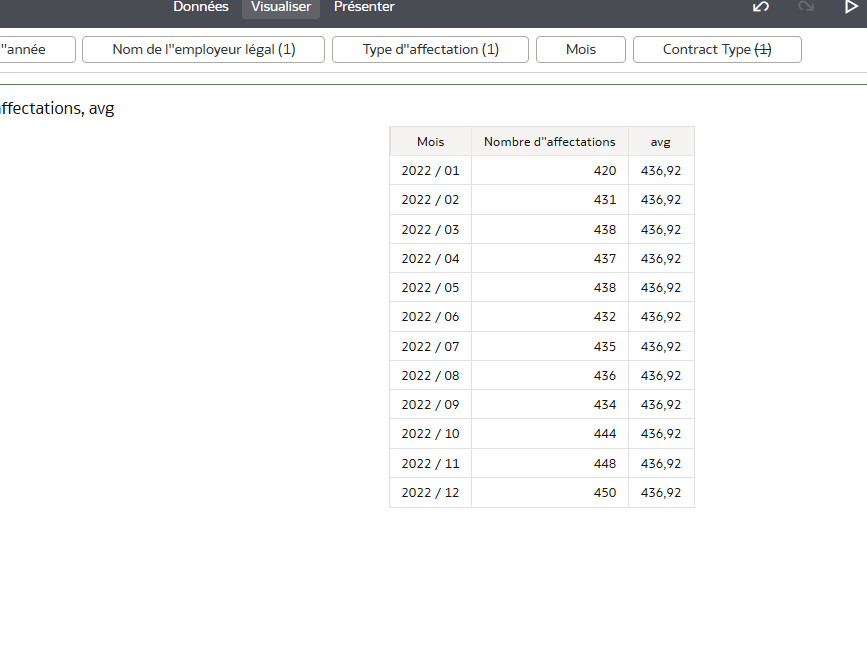
But it's not what I want.I'm trying to get sth like that (here Feminin and Masculin are the gender code female/male - and catégorie SP is the worker category.
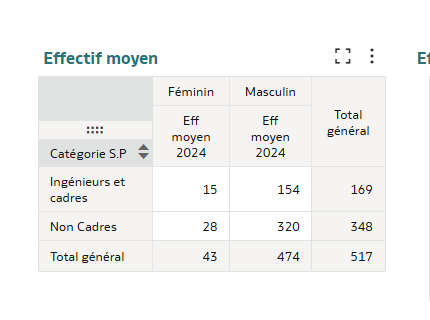
Here I should be able to have the average assigment of the female ingénieurs and cadre, female non cadre, male ingénieur, and male non cadre. I don't understand how I can achieve that…
Can you help me please?
Regards
0 -
Hi @Lauriane Massin Whitaker can you please re-share your reporting requirement. I can check and respond next week.
Raghu
0


