Oracle Transactional Business Intelligence

Welcome to the Oracle Analytics Community: Please complete your User Profile and upload your Profile Picture

OTBI - output not the same in dashboard vs analysis

Received Response
21
Views
6
Comments
User_RD03L
User_RD03L Rank 4 - Community Specialist

Hello,

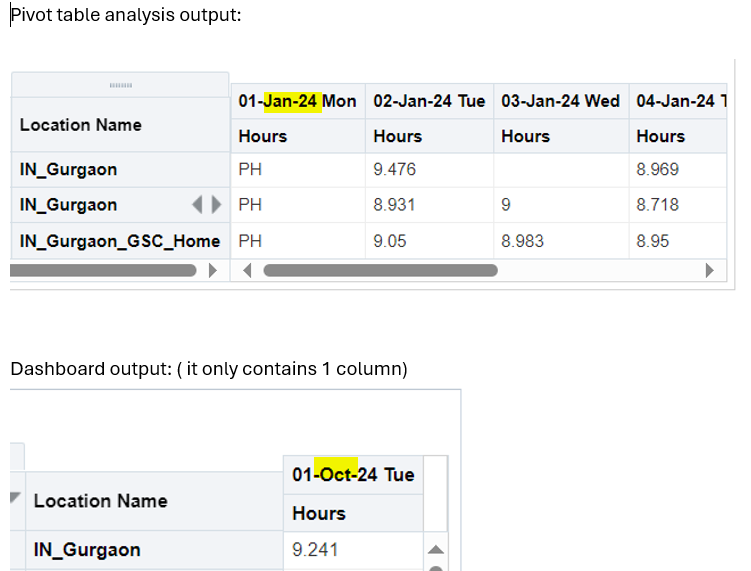
We have an issue in our OTBI dashboard wherein the output is not the same vs the linked analysis. Our expectation is that, on the Date column, it should display more than 1 columns. Kindly see the attached file.

Expectation: Output in the analysis should be the same in the Dashboard ( in terms of columns, rows..)

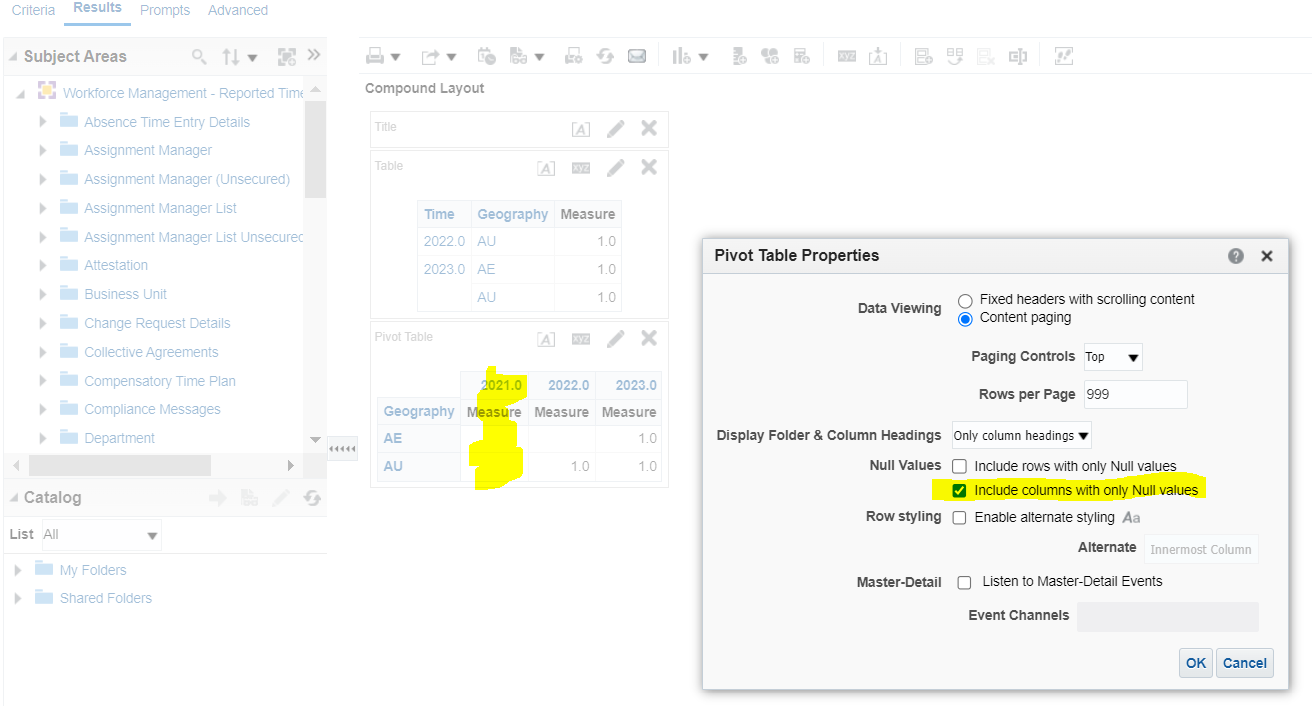
Can you please let us know what might have been the cause?

Thanks!

Tagged:

Answers

  • Nathan CCC
    Nathan CCC Rank 7 - Analytics Coach

    Hi, Yes the output on an analysis will always be the same as the output of the same analysis on a dashboard. You must be running the analysis with different parameters or the analysis on your dashboard is a different analysis or is being run by a different user with different data security roles / data access for users. Go to page mange sessions to compare the where clause in the query issued in each case.

  • User_RD03L
    User_RD03L Rank 4 - Community Specialist

    Hi Natan, yes we're using a date range prompts in the dashboard. Consisting of 1 week of data. Please see the attached file and let us know as to why it's not returning the desired output in the dashboard.

    Thank you!

  • Nathan CCC
    Nathan CCC Rank 7 - Analytics Coach
    edited Oct 9, 2024 2:12PM

    Hi,

    I think I have spotted the issue. Assume you are using the same user in the same browser with the same session in both cases. Assume the analysis and the analysis on the dashboard are the same analysis. But the difference is you are using different parameters. In one you are viewing January data and the other October data!

    If you view the same date range then assume in both cases it will display exactly the same data in exactly the same format whether you view results tab in the analysis or view that same analysis on a dashboard. Sorted.

    image.png

    If you view the sql on page manage sessions as I suggested you will see that the 2 queries were run with different where clauses (Jan and Oct) therefore that is why the data is displayed differently.

  • User_RD03L
    User_RD03L Rank 4 - Community Specialist

    Hello, sorry, what I meant by 'not returning the desired output' is that when in the Analysis view, filters used are Jan1-7 dates while for the Dashboard view, it's using date range Oct 2-9. The output view on the dashboard only consist of 1 column even though the date range prompt used was 7days (Oct2-9).

    Our expectation is that when we used date range Oct2-9 in the dashboard, it should also extract 7days worth of data.

  • Nathan CCC
    Nathan CCC Rank 7 - Analytics Coach

    Hi, OK. So you agree that this issue has nothing at all to do with the mode you consume the analysis. If you edit the analysis view results tab or open a dashboard page with the analysis you get exactly the same results displayed in both cases if you use the same date range of 7 days YYYY-10-02 to 10-09. You looked at manage sessions page to confirm that the system issues exactly the same SQL with same where clause so get same data.

    As to why you only get 1 day in the 7 days. That is easy. I assume there is no data for the other days. If you, for the purpose of understanding only, put the original table view on top of the pivot table view on that compound layout, you get no rows for the other 6 days for the locations selected in the table view. Yes? If so, then you can NOT expect to see rows displayed in the pivot for days that do not exist. For a day to be displayed in the pivot table by default then at least one of the locations must have a row with some amount of hours in fact measure.

    All subject areas work this way. That is the design principle of a "star schema". For more information read about dimensional models for example Kimball et al. https://www.kimballgroup.com/data-warehouse-business-intelligence-resources/kimball-techniques/. The subject areas are designed in general to tell you "what did happen" but not "what did not happen". The question you are asking is "which locations had no data this day. That is, by no data, we mean there was no transaction at all rather than a transaction with zero hours entered. So by default the tables joins in the view objects generated by the metadata repository database from your analysis query are INNER JOIN.

    So your question is "if there is no rows for a pivot column dimension value how do I make it so that column is displayed in a pivot table"?

    If you want to answer a question like this "what did not happen" then a solution that will work is to edit the SQL in your analysis to use OUTER JOIN. So split up your query into query 1 from time dimension and query 2 the other dimensions so you will always get a row for each day whether or not any transactions exist.

  • Nathan CCC
    Nathan CCC Rank 7 - Analytics Coach
    edited Oct 10, 2024 8:26AM

    Alternative you can edit the properties of the pivot table to "include columns with null values"

    image.png