Categories
- All Categories
- Oracle Analytics and AI Learning Hub
- 54 Oracle Analytics and AI Sharing Center
- 25 Oracle Analytics and AI Lounge
- 307 Oracle Analytics and AI News
- 57 Oracle Analytics and AI Videos
- 16.4K Oracle Analytics and AI Forums
- 6.6K Oracle Analytics and AI Labs
- Oracle Analytics and AI User Groups
- 118 Oracle Analytics and AI Trainings
- 22 Oracle Analytics and AI Challenge
- Find Partners
- For Partners
Create a Pie Chart with colored slices based on the description (RTF Publisher)

Hello Team,
we would like to create a pie chart in Oracle Bi Publisher RTF in which the pie slices are colored using a conditional formatting. This is possibile in the BI analytics like in the following image.
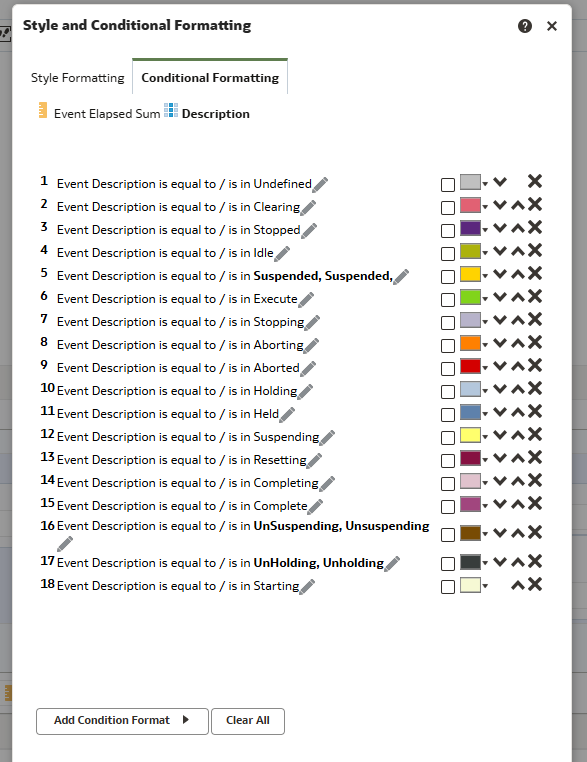
However, we tried to modify the XML code in the pie advanced tab. Our goal is to give a particular color for each event description to get the same pie chart that we see in the Bi Analytics.
This is the original code, in which we tried to give to the id series a color in the builder tab, but we cannot choose the specific description (it selects the attribute in alphabetical order):
<Graph seriesEffect="SE_NONE" graphType= "PIE"><LegendArea visible="true"/>
<SeriesItems><Series id="0" color="#FF0000"/></SeriesItems>
<SliceLabel visible="true"><ViewFormat decimalDigit="1" decimalDigitUsed="true"/>
</SliceLabel>
<DataValues><xsl:for-each-group select=".//DATASET_STATE" group-by="EVENT_DESCRIPTION"><xsl:sort select="current-group()/EVENT_DESCRIPTION"/>
<RowData><Cell><xsl:value-of select="sum(current-group()/STATE_ELAPSED[.!=''])"/></Cell></RowData></xsl:for-each-group></DataValues>
</LocalGridData>
</Graph>
<LocalGridData colCount="1" rowCount="{count(xdoxslt:group(.//DATASET_STATE, 'EVENT_DESCRIPTION'))}">
<RowLabels><xsl:for-each-group select=".//DATASET_STATE" group-by="EVENT_DESCRIPTION"><xsl:sort select="current-group()/EVENT_DESCRIPTION"/>
<Label><xsl:value-of select="current-group()/EVENT_DESCRIPTION"/></Label></xsl:for-each-group></RowLabels>
This is the new code, that doesn't work properly:
<Graph seriesEffect="SE_NONE" graphType= "PIE"><LegendArea visible="true"/>
<SeriesItems><xsl:for-each-group select=".//DATASET_STATE" group-by="EVENT_DESCRIPTION"><xsl:sort select="current-group()/EVENT_DESCRIPTION"/><Series id="0" color="#FF0000"/><Series id="{position()}"><xsl:attribute name="color"><xsl:when test="current-group()/EVENT_DESCRIPTION = 'Aborted'">#FF0000</xsl:when>
xsl:otherwise#FFFF00</xsl:otherwise>
</xsl:choose>
</xsl:attribute>
</Series>
</xsl:for-each-group>
<SliceLabel visible="true"><ViewFormat decimalDigit="1" decimalDigitUsed="true"/>
</SliceLabel>
<DataValues><xsl:for-each-group select=".//DATASET_STATE" group-by="EVENT_DESCRIPTION"><xsl:sort select="current-group()/EVENT_DESCRIPTION"/>
<RowData><Cell><xsl:value-of select="sum(current-group()/STATE_ELAPSED[.!=''])"/></Cell></RowData></xsl:for-each-group></DataValues>
</LocalGridData>
</Graph>
</SeriesItems><LocalGridData colCount="1" rowCount="{count(xdoxslt:group(.//DATASET_STATE, 'EVENT_DESCRIPTION'))}">
<RowLabels><xsl:for-each-group select=".//DATASET_STATE" group-by="EVENT_DESCRIPTION"><xsl:sort select="current-group()/EVENT_DESCRIPTION"/>
<Label><xsl:value-of select="current-group()/EVENT_DESCRIPTION"/></Label></xsl:for-each-group></RowLabels>
We don't know why when we use xsl:choose it automatically takes the link that is present in the code.
Can anyone help us? Thanks
Answers
-
Hi @_vero_
We don't know why when we use xsl:choose it automatically takes the link that is present in the code. —> which link its taking as per above code, can you share me more details?
Regards,
Arjun
0 -
Hi Arjun,
in this code there isn't the link that every now and then appears automatically in the xml of the graphs. I report it below:
xmlns:xsl="http://www.w3.org/1999/XSL/Transform"
In any case, is there a way to set the coloring of the pie slices in the same way as analytics as you see in the image above?
Thanks in advance
0
