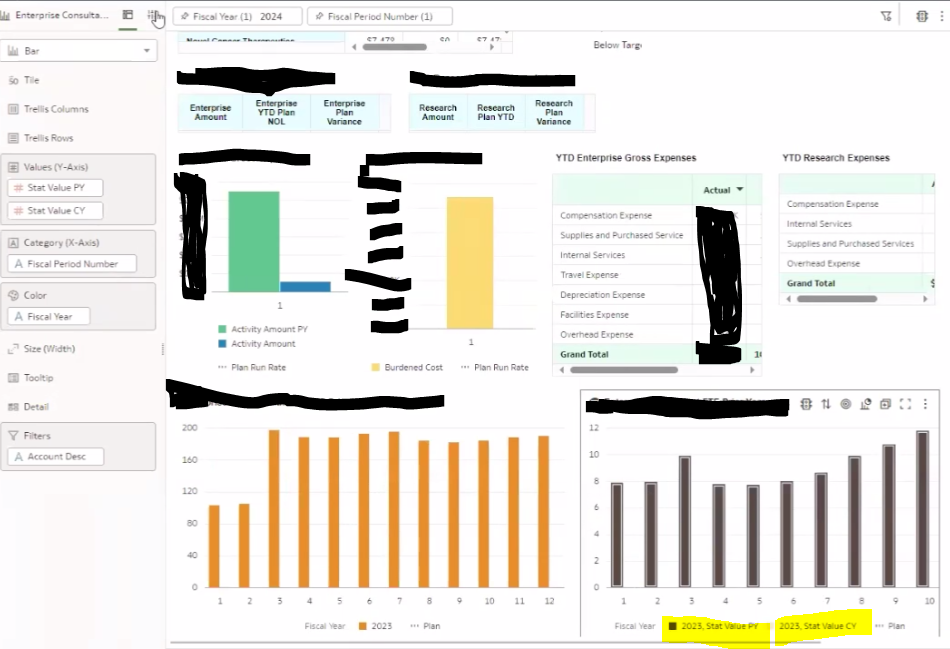
More flexibility on color assignments. More flexibility to edit legend title in graph highlighted in yellow in the below screenshot
A new "Legend" Data Visualization type has been released with more options. We will continue to add additional options to it.
@Sreekumar_Analytics_Ambassador In your example, are you referring to the values of the Fiscal Year attribute? As these might be completely dynamic, we will unlikely allow the user to change those on the chart. You can create a My Calc that translates those to different labels. Regarding color assignment, what additional flexibility do you need here?
Hi Gabby Rubin-Oracle - Thanks for your question and explanation. In the example - More flexibility on color assignments for the fiscal year graph and more flexibility to edit legend title in graph highlighted in yellow in the bottom right corner.
Benjamin Arnulf-Oracle-Thanks for the update
Benjamin Arnulf-Oracle
-Thanks for the update
Sorry, I'm still not clear. You can change the colors of the individual values today; what else is required?
The other ask was to have more flexibility to edit legend title in graph highlighted in yellow in the bottom right corner.