Oracle Analytics Cloud and Server

Welcome to the Oracle Analytics Community: Please complete your User Profile and upload your Profile Picture

A column drag box appeared unexpectedly above the bar chart in embedded DV workbook on BI classic

Received Response
31
Views
6
Comments
Dhaval Parikh Stantec
Dhaval Parikh Stantec Rank 6 - Analytics Lead

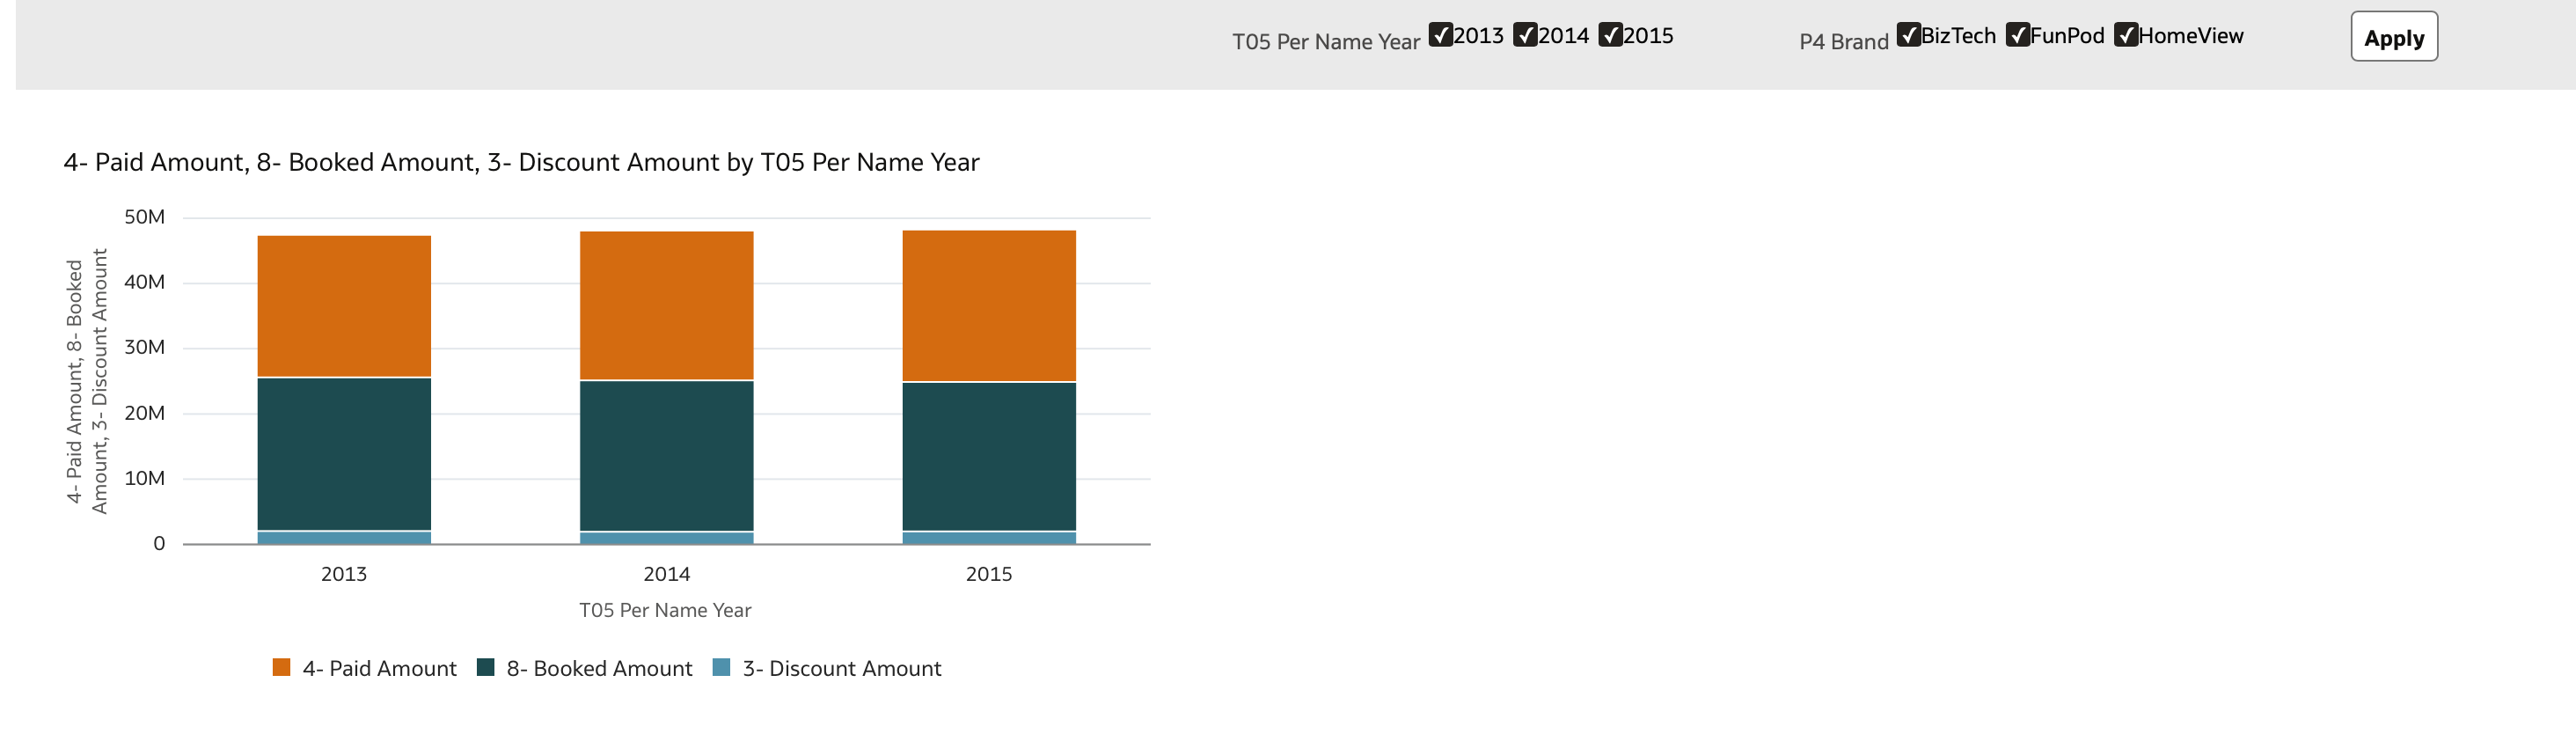
We are on OAS 7.6. One of our report consumers reported this issue where they see a column drag indicator appeared unexpectedly above the stacked bar chart in an embedded DV workbook on the BI classic dashboard.

Has anyone seen this before? Is there a way to turn off the ability for users to move columns? We don't want the users to be able to move them around.

Answers

  • SteveF-Oracle
    edited Feb 10, 2025 10:15PM

    Hi @Dhaval Parikh Stantec,

    When you state "appeared unexpectedly ", do you mean that this behavior did not occur previously for the user, then the behavior changed?, or do you mean to say the user just never noticed this and now they are reporting the behavior?

    I do not seem to reproduce the behavior, but really just going off your screenshot. I have seen the drag bar in specific cases. There may be more navigation, or other details we do not have (specific browsers, classic dashboard settings, workbook/canvas properties, etc.).

    image.png

    Other comments, welcomed.

  • Thanks @SteveF-Oracle for your prompt response! Honestly, I wasn't able to reproduce the error either on my end. I wouldn't have believed it, but the user recorded the video and sent it to me showing the column drag option. We are using the Microsoft edge browser. Hopefully the OAS 7.6 patch can resolve some of these UI issues

  • Ok, I was testing with the October 2024 stack patch, Safari (Version 18.1.1 (20619.2.8.11.12))

    Perhaps related to layout?

    These are my canvas properties.

    Can share other properties, if needed.

    image.png
  • Hi @Dhaval Parikh Stantec ,

    Are you using the visibility parameter option in your DV workbook to select whether to display the bar chart or another visualization?

    I had exactly the same issue when trying to implement a view selector in a DV workbook, and a table was placed on top of another visualization (e.g. a bar chart). It looks like a bug, the table is hidden because of the visibility parameter option, but it's still in the canvas and you can hover to select and move the columns

  • Thanks @Federico Venturin!

    I agree, I have encountered something similar, a long while back, in an earlier update of OAC/OAS, but never could re-create it. If we can get a reproducible case, we can report it 😁🐜

  • Dhaval Parikh Stantec
    Dhaval Parikh Stantec Rank 6 - Analytics Lead

    Thanks @Federico Venturin! We don't yet have access to the visibility parameter feature as we are still on OAS 7.6. It's a weird bug that only 1 person observed it so far