Categories
- All Categories
- Oracle Analytics and AI Learning Hub
- 44 Oracle Analytics and AI Sharing Center
- 20 Oracle Analytics and AI Lounge
- 278 Oracle Analytics and AI News
- 56 Oracle Analytics and AI Videos
- 16.2K Oracle Analytics and AI Forums
- 6.4K Oracle Analytics and AI Labs
- Oracle Analytics and AI User Groups
- 103 Oracle Analytics and AI Trainings
- 20 Oracle Analytics and AI Challenge
- Find Partners
- For Partners
Global Population Trends (1950-2023) Shifts: A Dynamic View


Author: Thomas Lee
Title: Global Population Shifts: A Dynamic View
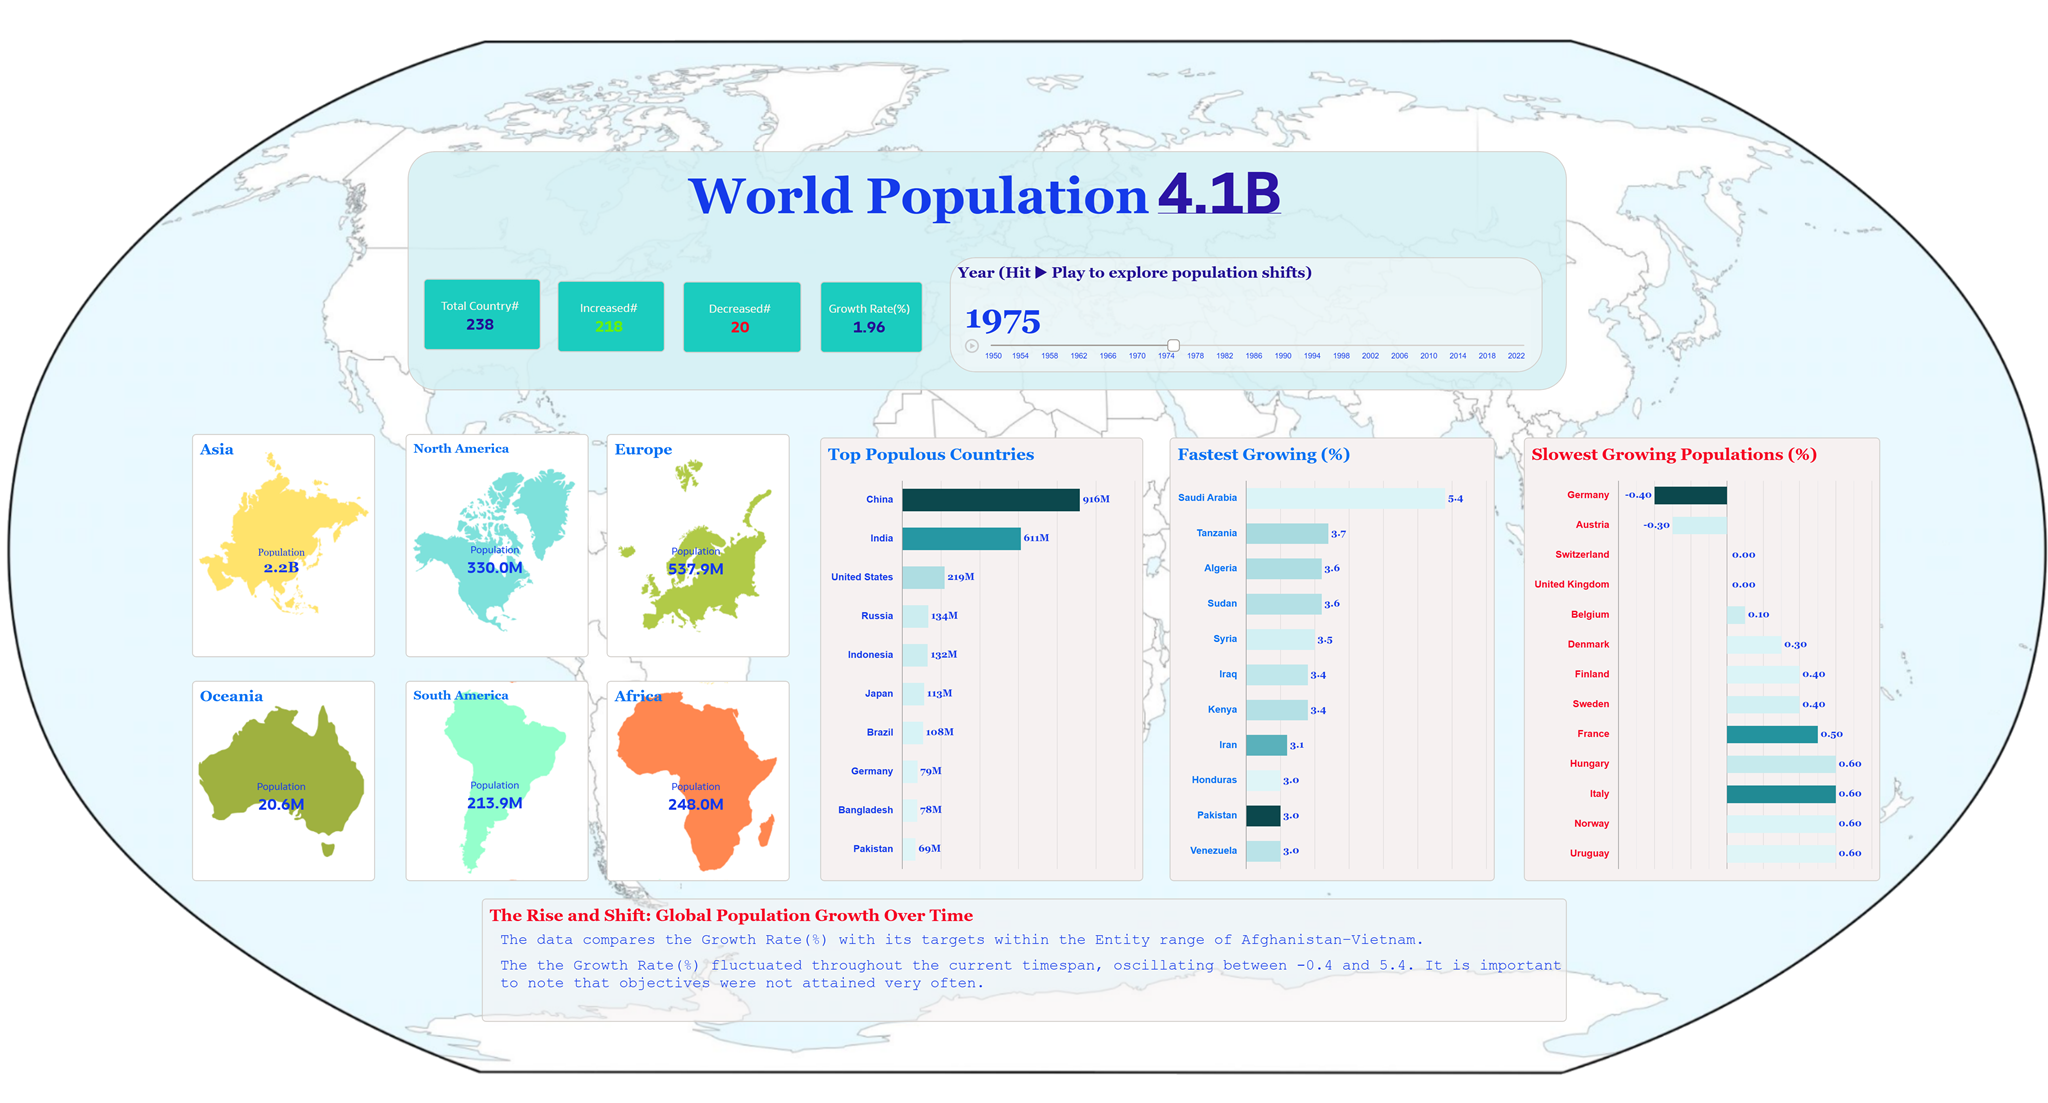
This interactive data visualization, Global Population Shifts: A Dynamic View, explores global population trends from 1950 to 2023, using data from WorldData.org. It highlights growth rates, the most populous countries, and year-over-year changes, enabling users to track demographic shifts over time.
With an interactive slider and play feature, users can dynamically explore population trends and regional evolution, making it easier to visualize historical and modern growth patterns.
Designed for demographers, researchers, policymakers, educators, and data enthusiasts, this visualization offers a clear and engaging way to analyze population distribution and trends over decades.
The goal is to transform historical data into actionable insights, allowing users to interactively explore trends, compare regions, and understand long-term global population dynamics in an intuitive format.
All the Best,
Thomas J Lee
Comments
-
oh wonderful ! Very informative .
3 -
Very cool visualization, @Thomas J Lee! I love the use of the slider!
3 -
Wow, Beautiful.
Thanks for sharing @Thomas J Lee!
3 -
Great viz @Thomas J Lee ! I am super excited to get this viz in front of the Data Visualization Challenge judges!!
3 -
Beautiful design!
2 -
I like sliders. Good work.
2 -
Awesome design!
1


