Categories
- All Categories
- Oracle Analytics and AI Learning Hub
- 44 Oracle Analytics and AI Sharing Center
- 20 Oracle Analytics and AI Lounge
- 278 Oracle Analytics and AI News
- 56 Oracle Analytics and AI Videos
- 16.2K Oracle Analytics and AI Forums
- 6.4K Oracle Analytics and AI Labs
- Oracle Analytics and AI User Groups
- 103 Oracle Analytics and AI Trainings
- 20 Oracle Analytics and AI Challenge
- Find Partners
- For Partners
MahaKumbh 2025 Footprint Analysis


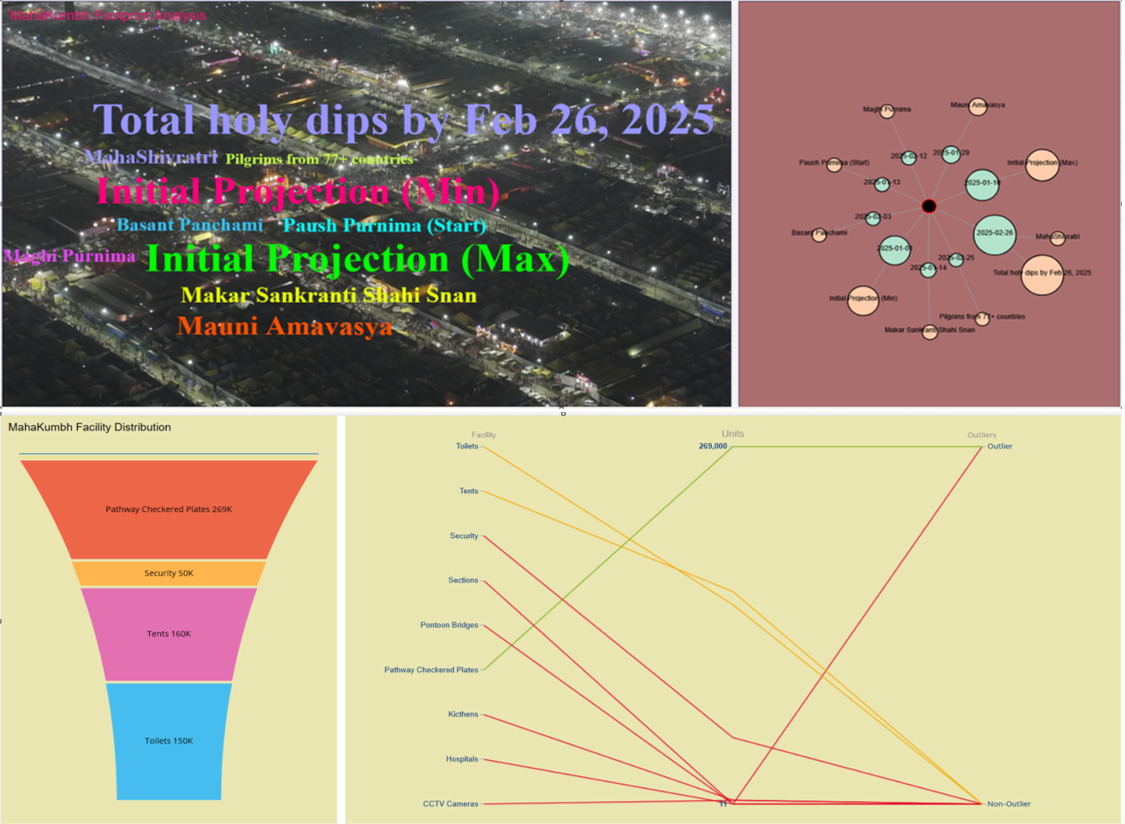
MahaKumbh 2025 demonstrated the scale and complexity of planning a massive public event, and Oracle Analytics played a key role in revealing meaningful insights. Through a combination of visual storytelling—using Force-Directed Graphs, Tag Clouds, a Funnel Plugin Visualization, and Parallel Coordinates—key insights were uncovered across both infrastructure and crowd behavior. Facility deployment patterns highlighted strategic prioritization of essential services, supporting deeper analysis into resource planning efficiency.
Facility distribution analysis revealed key outliers, with certain infrastructure—like pedestrian pathways—deployed at much higher scale, highlighting a focus on crowd movement and safety. Identifying such outliers helps evaluate where resources were heavily concentrated and whether those choices were effective.
The event timeline was brought to life through dynamic visualizations of footprint data, revealing how turnout progression aligned closely with initial projections—instilling confidence in the forecasting models used during planning. With participation from across the globe, MahaKumbh’s scale extended beyond its spiritual significance to a massive logistical achievement. These visualizations collectively showcase the strength of Oracle Analytics in transforming complex datasets into clear, actionable insights for planning and managing future large-scale events.
Comments
-
Thank you for sharing!
1 -
Beautiful presentation.
Thanks for sharing @MayuriK-Oracle!
0 -
Nice! thanks for sharing!
0 -
Impressive use case and analysis! You've done a great job showcasing how Oracle Analytics helped uncover critical insights. Thank you for sharing your viz and including background info with a detailed analysis for the insights you uncovered @MayuriK-Oracle !
0


