Categories
- All Categories
- 15 Oracle Analytics Sharing Center
- 14 Oracle Analytics Lounge
- 211 Oracle Analytics News
- 41 Oracle Analytics Videos
- 15.7K Oracle Analytics Forums
- 6.1K Oracle Analytics Idea Labs
- Oracle Analytics User Groups
- 77 Oracle Analytics Trainings
- 14 Oracle Analytics Data Visualizations Challenge
- Find Partners
- For Partners
Radar view for OTBI

Summary:
Customize the radar view when creating OTBI
Content (please ensure you mask any confidential information):
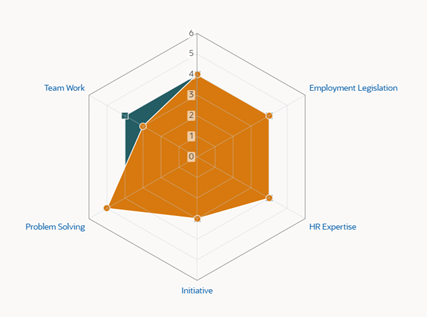
Hello, we have created an OTBI analysis with Radar type of view. However, it seems it is possible to only customize the different lines and the color of the entire plot area, but I'm not able to achieve the output displayed in the screenshot here, which has the interested area fully colored (the one in orange or green). Does anyone know how to do it? Thanks in advance. Best regards
Version (include the version you are using, if applicable):
25A
Code Snippet (add any code snippets that support your topic, if applicable):
Answers
-
Hi Oriana
Please review the given help center documentation about Edit view
https://docs.oracle.com/en/cloud/saas/otbi/otbi-user/graph-data-analyses.html#GUID-BD555AE3-9810-4DDC-8A54-F687DD278743
Edit the Graphical view—>Click on XYZ option Graph properties—>Click on Style or Tiles and Labels and set the color as per your requirement.
0 -
Hi @Rajasekhar Bandaru-Oracle I've tried to customize the layout for the chart as you've suggested, however it seems it is only possible to customize the lines of the chart rather than the entire area within these lines. Regards
0