Categories
- All Categories
- Oracle Analytics and AI Learning Hub
- 43 Oracle Analytics and AI Sharing Center
- 19 Oracle Analytics and AI Lounge
- 283 Oracle Analytics and AI News
- 60 Oracle Analytics and AI Videos
- 16.3K Oracle Analytics and AI Forums
- 6.4K Oracle Analytics and AI Labs
- Oracle Analytics and AI User Groups
- 108 Oracle Analytics and AI Trainings
- 20 Oracle Analytics and AI Challenge
- Find Partners
- For Partners
Welcome to the Oracle Analytics Community: Please complete your User Profile and upload your Profile Picture
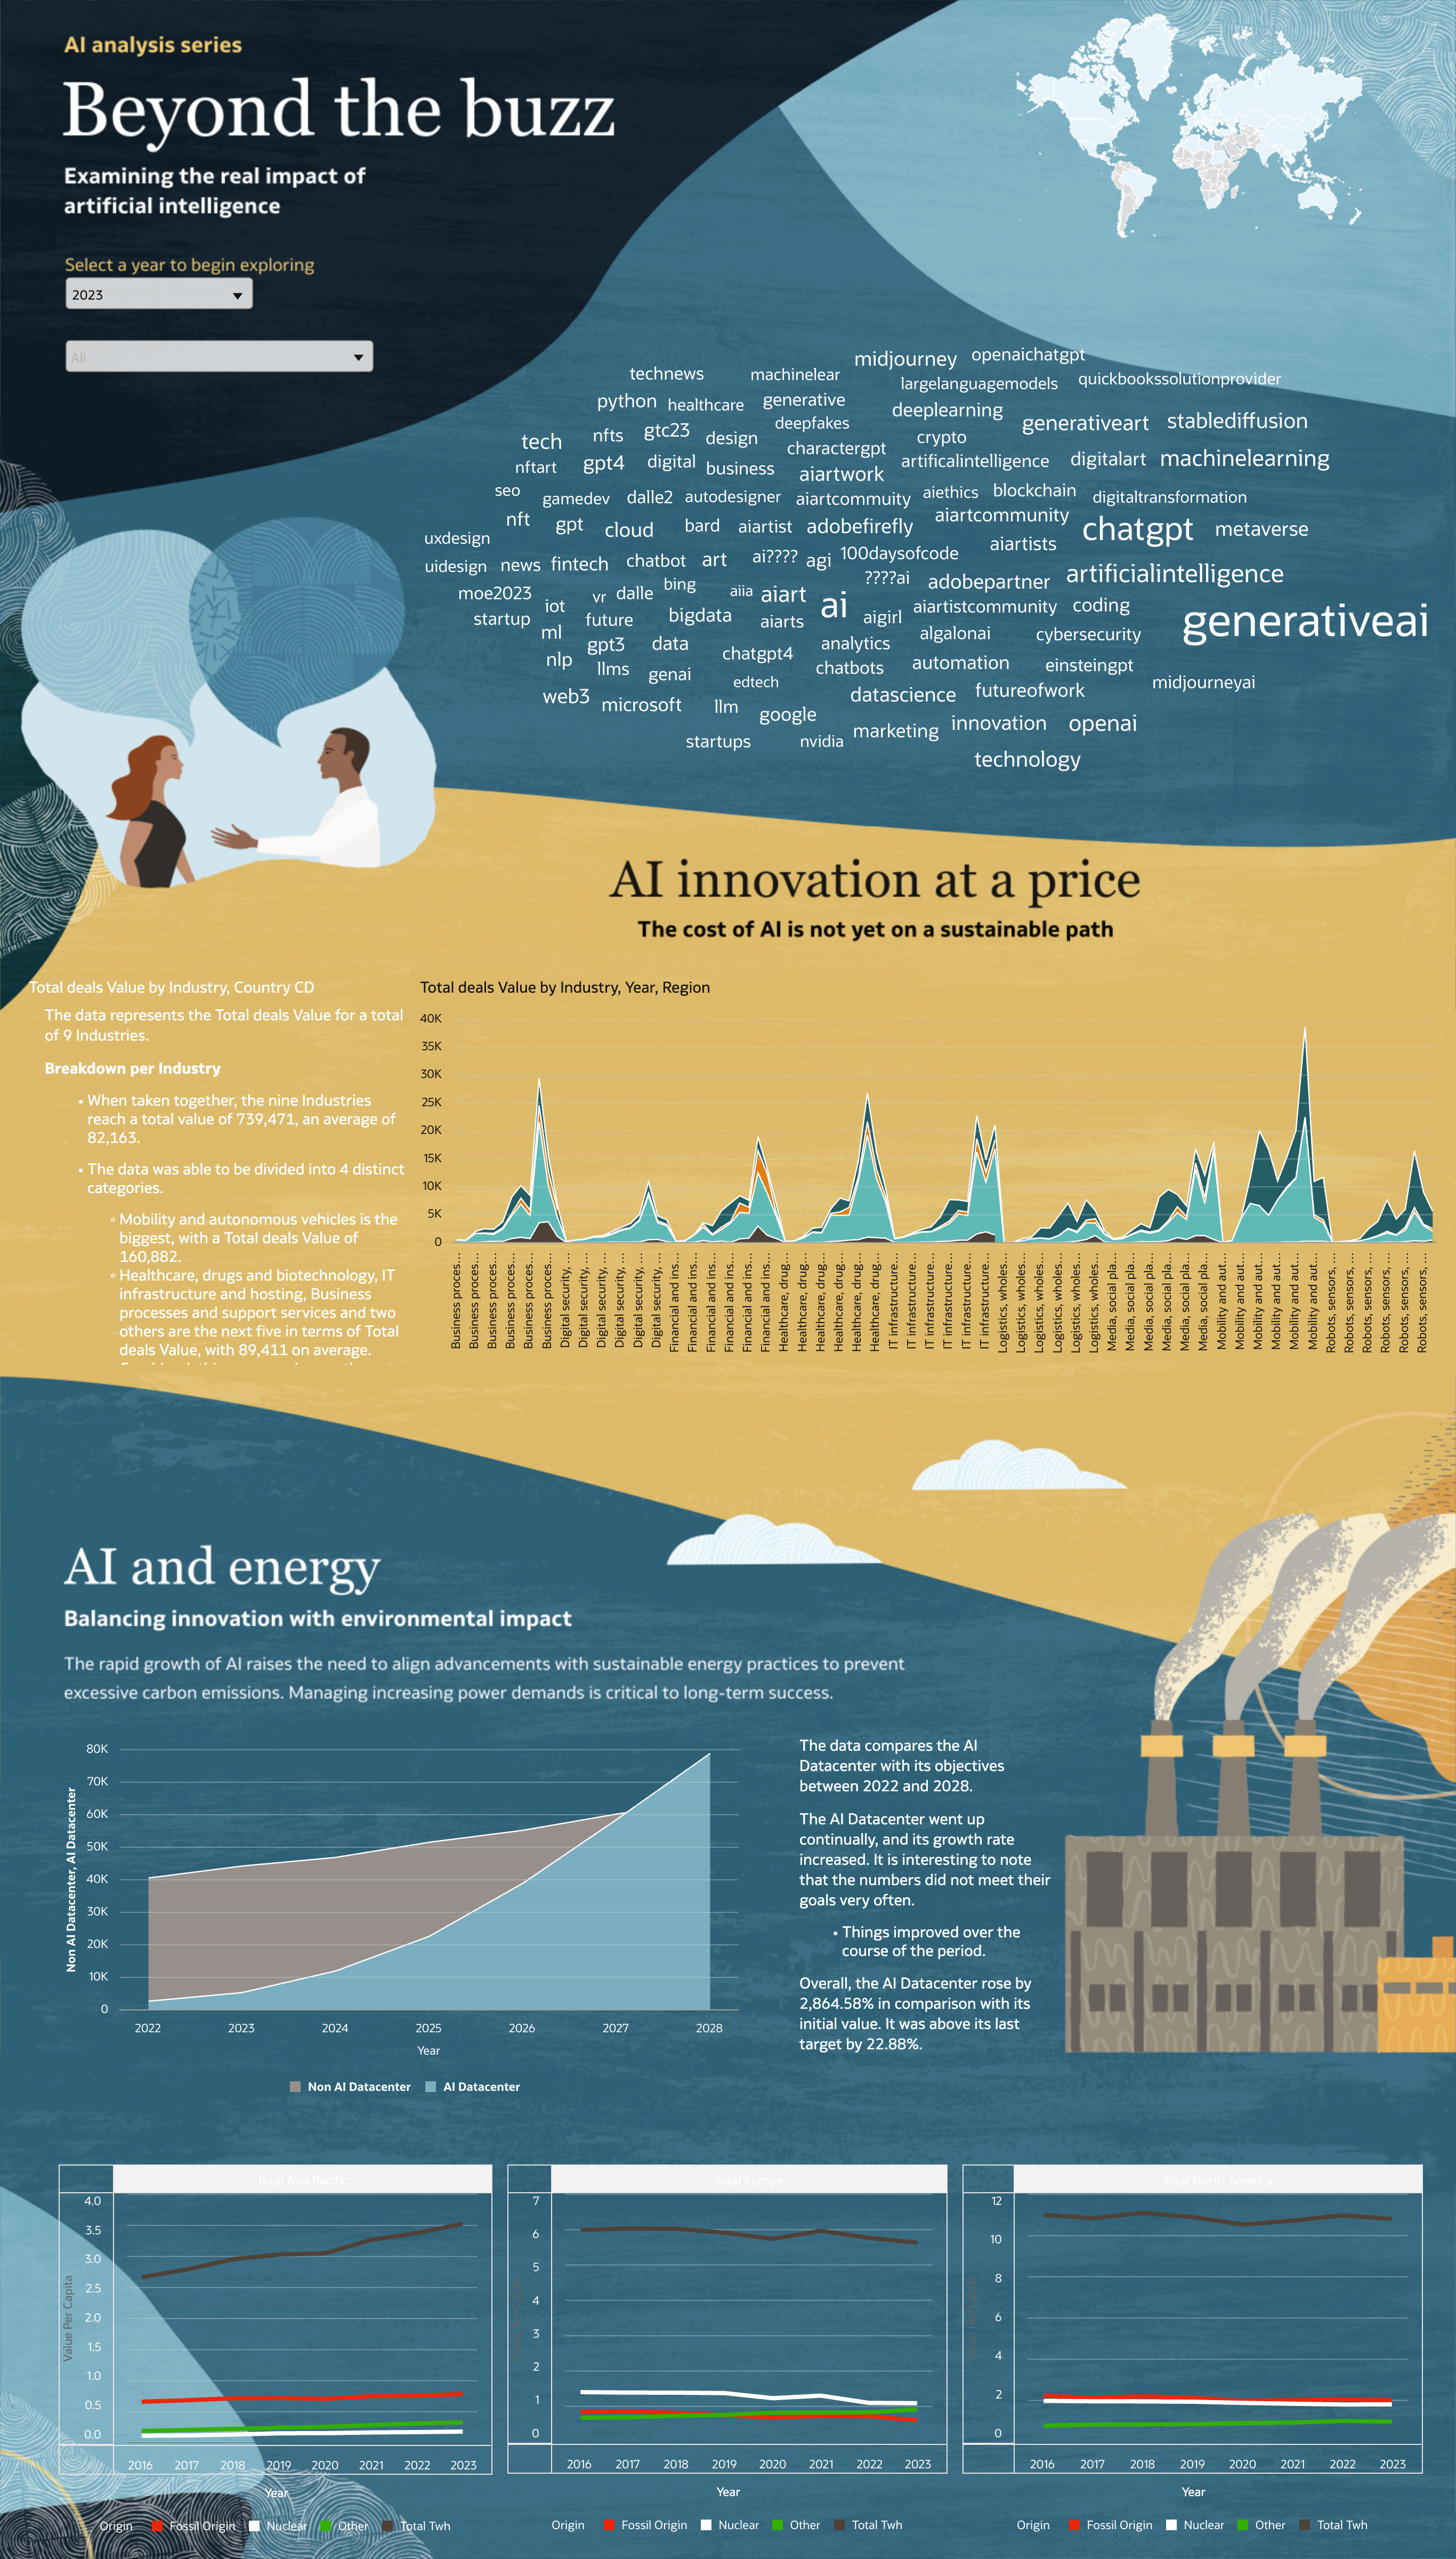
AI Energy Consumption Dashboard

This AI infographic dashboard was created for the 2025 Gartner Analytics and BI Bake-Off, where Oracle competed on stage against Tableau and Strategy. All three vendors were given the same dataset and script to follow, allowing the audience to see live side-by-side product comparison demos between the platforms and their capabilities. This year's data focused on AI and the technical theme asked "How GenAI is Augmenting Analytics and Business Intelligence Platforms?"
You can watch the full demo here:
8
Comments
-
Cool ones!
0 -
@Brendan J. Doyle-Oracle this is fascinating! Love the word cloud.
1 -
This is a good info graphic style visualzation with good use of the redwood background
0 -
@Brendan J. Doyle-Oracle great job! Love this!
0


