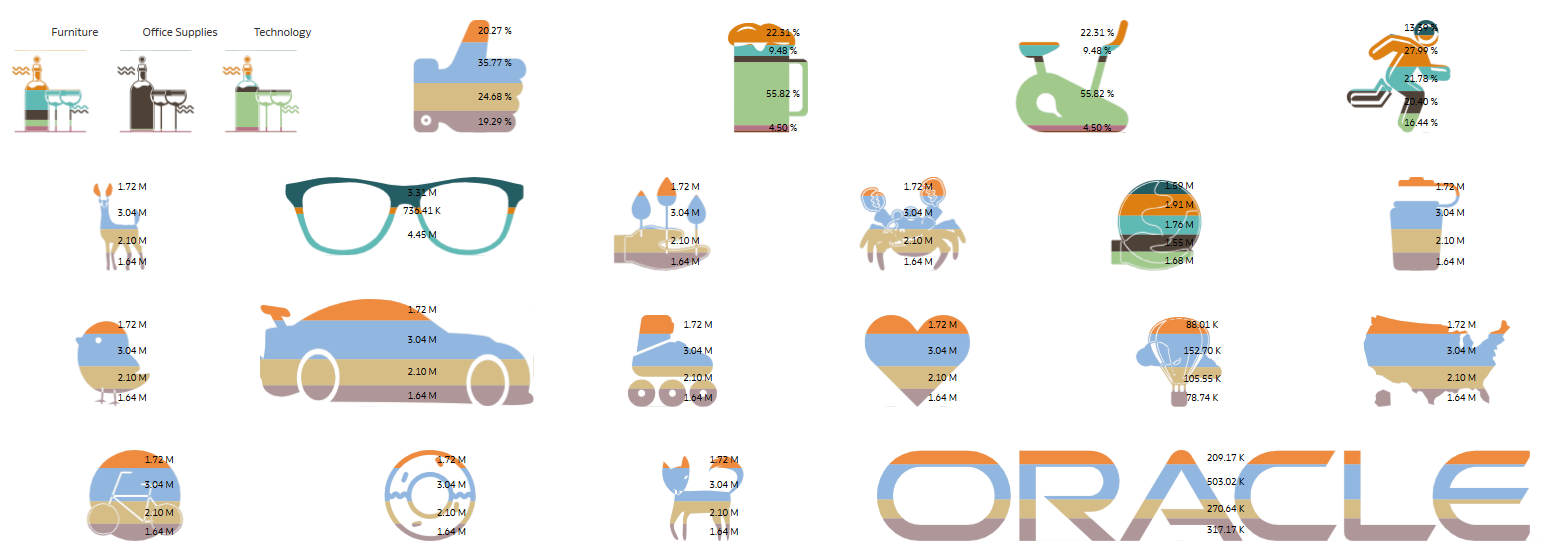
We're excited to introduce our new PictoStack custom extension for Oracle Analytics. Simple to use and visually striking, Pictostack lets you transform your own SVG images into stacked, data-rich infographic visualizations in just a few clicks. It's a great example of how Oracle Analytics SDK can be leveraged to create compelling, custom visual experiences. Special thanks to @Prasenjit_Thakur-Oracle for this cool innovation !
Note: For best results, use simple SVG images. Complex SVGs may not render as expected. If you run into issues, check the Readme.txt for troubleshooting steps.
Refer to this video to learn about this extension https://youtu.be/dd_nK-_2bV4?si=MXnFwwes9oZGR7LW
- Deploy this example custom extension on your own Oracle Analytics
- Sample reference set of clean, ready-to-use images to help you get started
- Readme.txt for troubleshooting steps