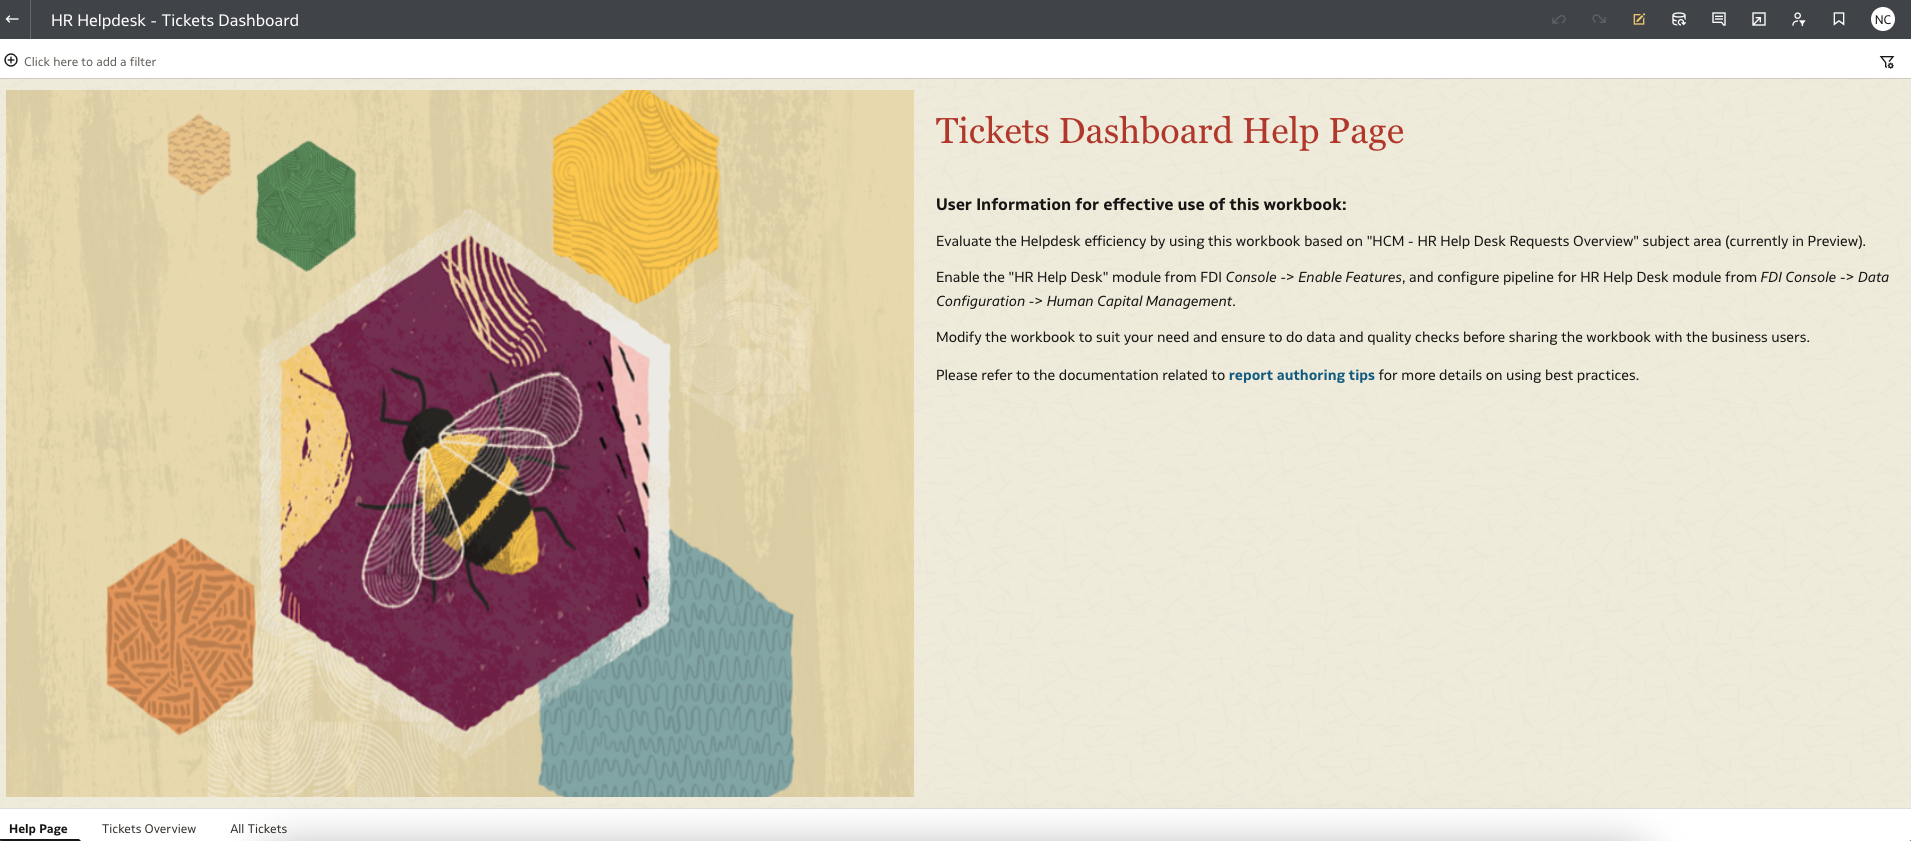
This FDI dashboard can be used to visualize data from HCM - Helpdesk module. The dashboard contains the following information -
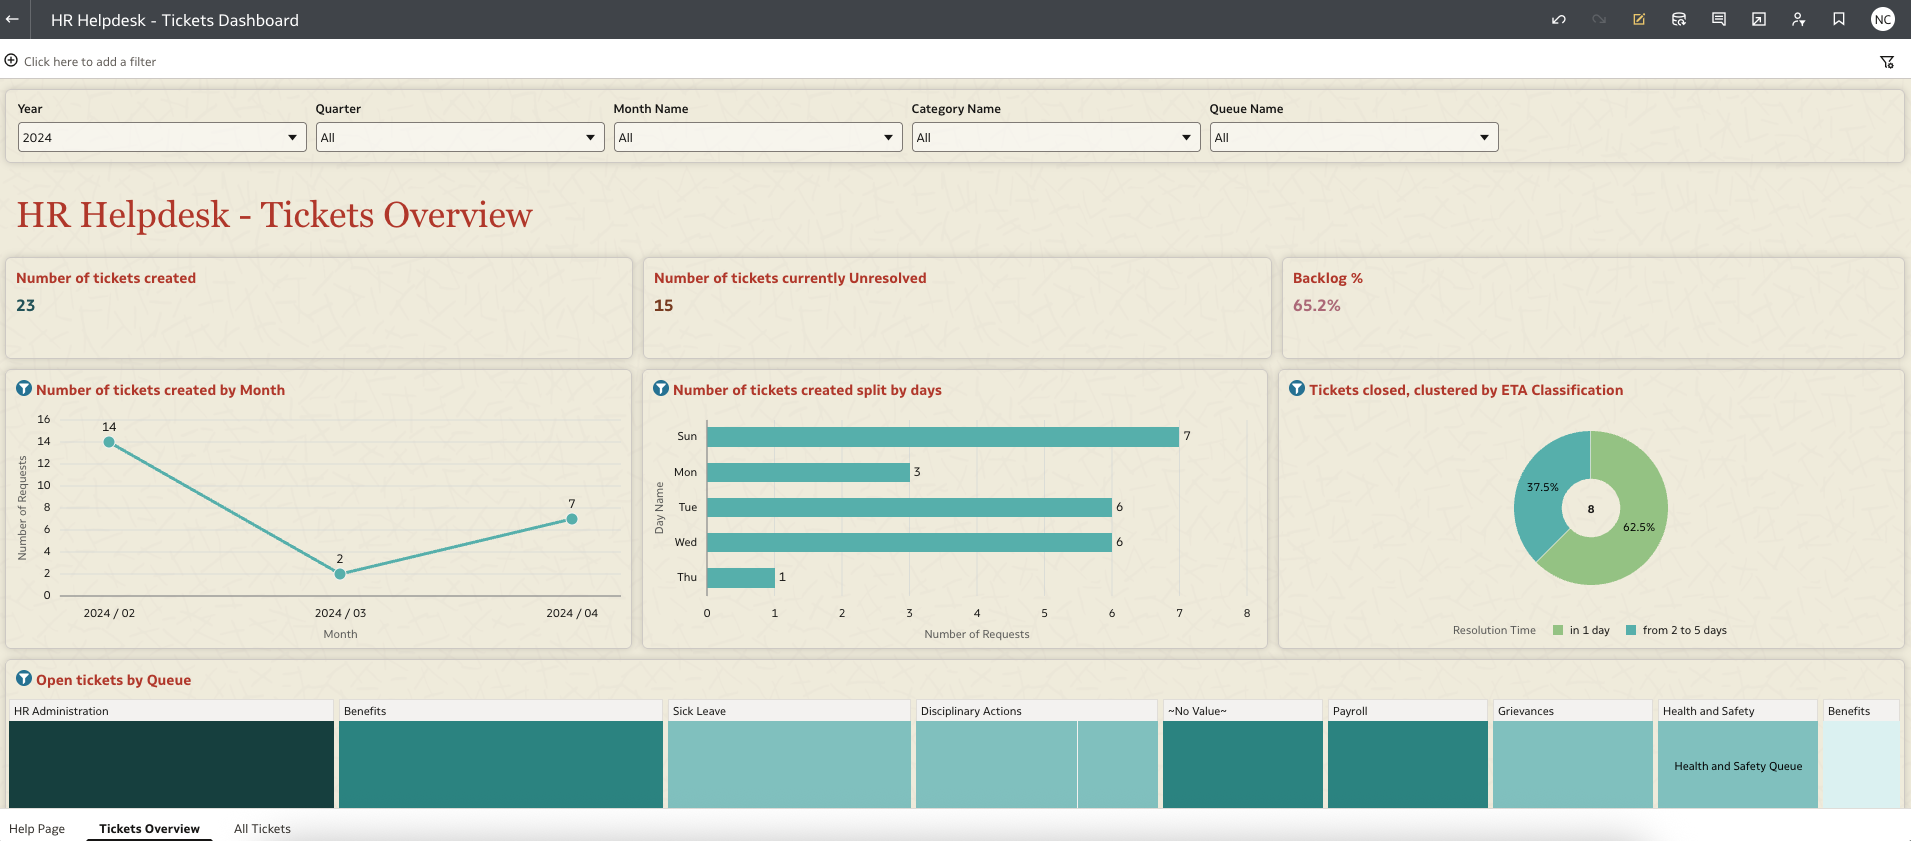
Summary page
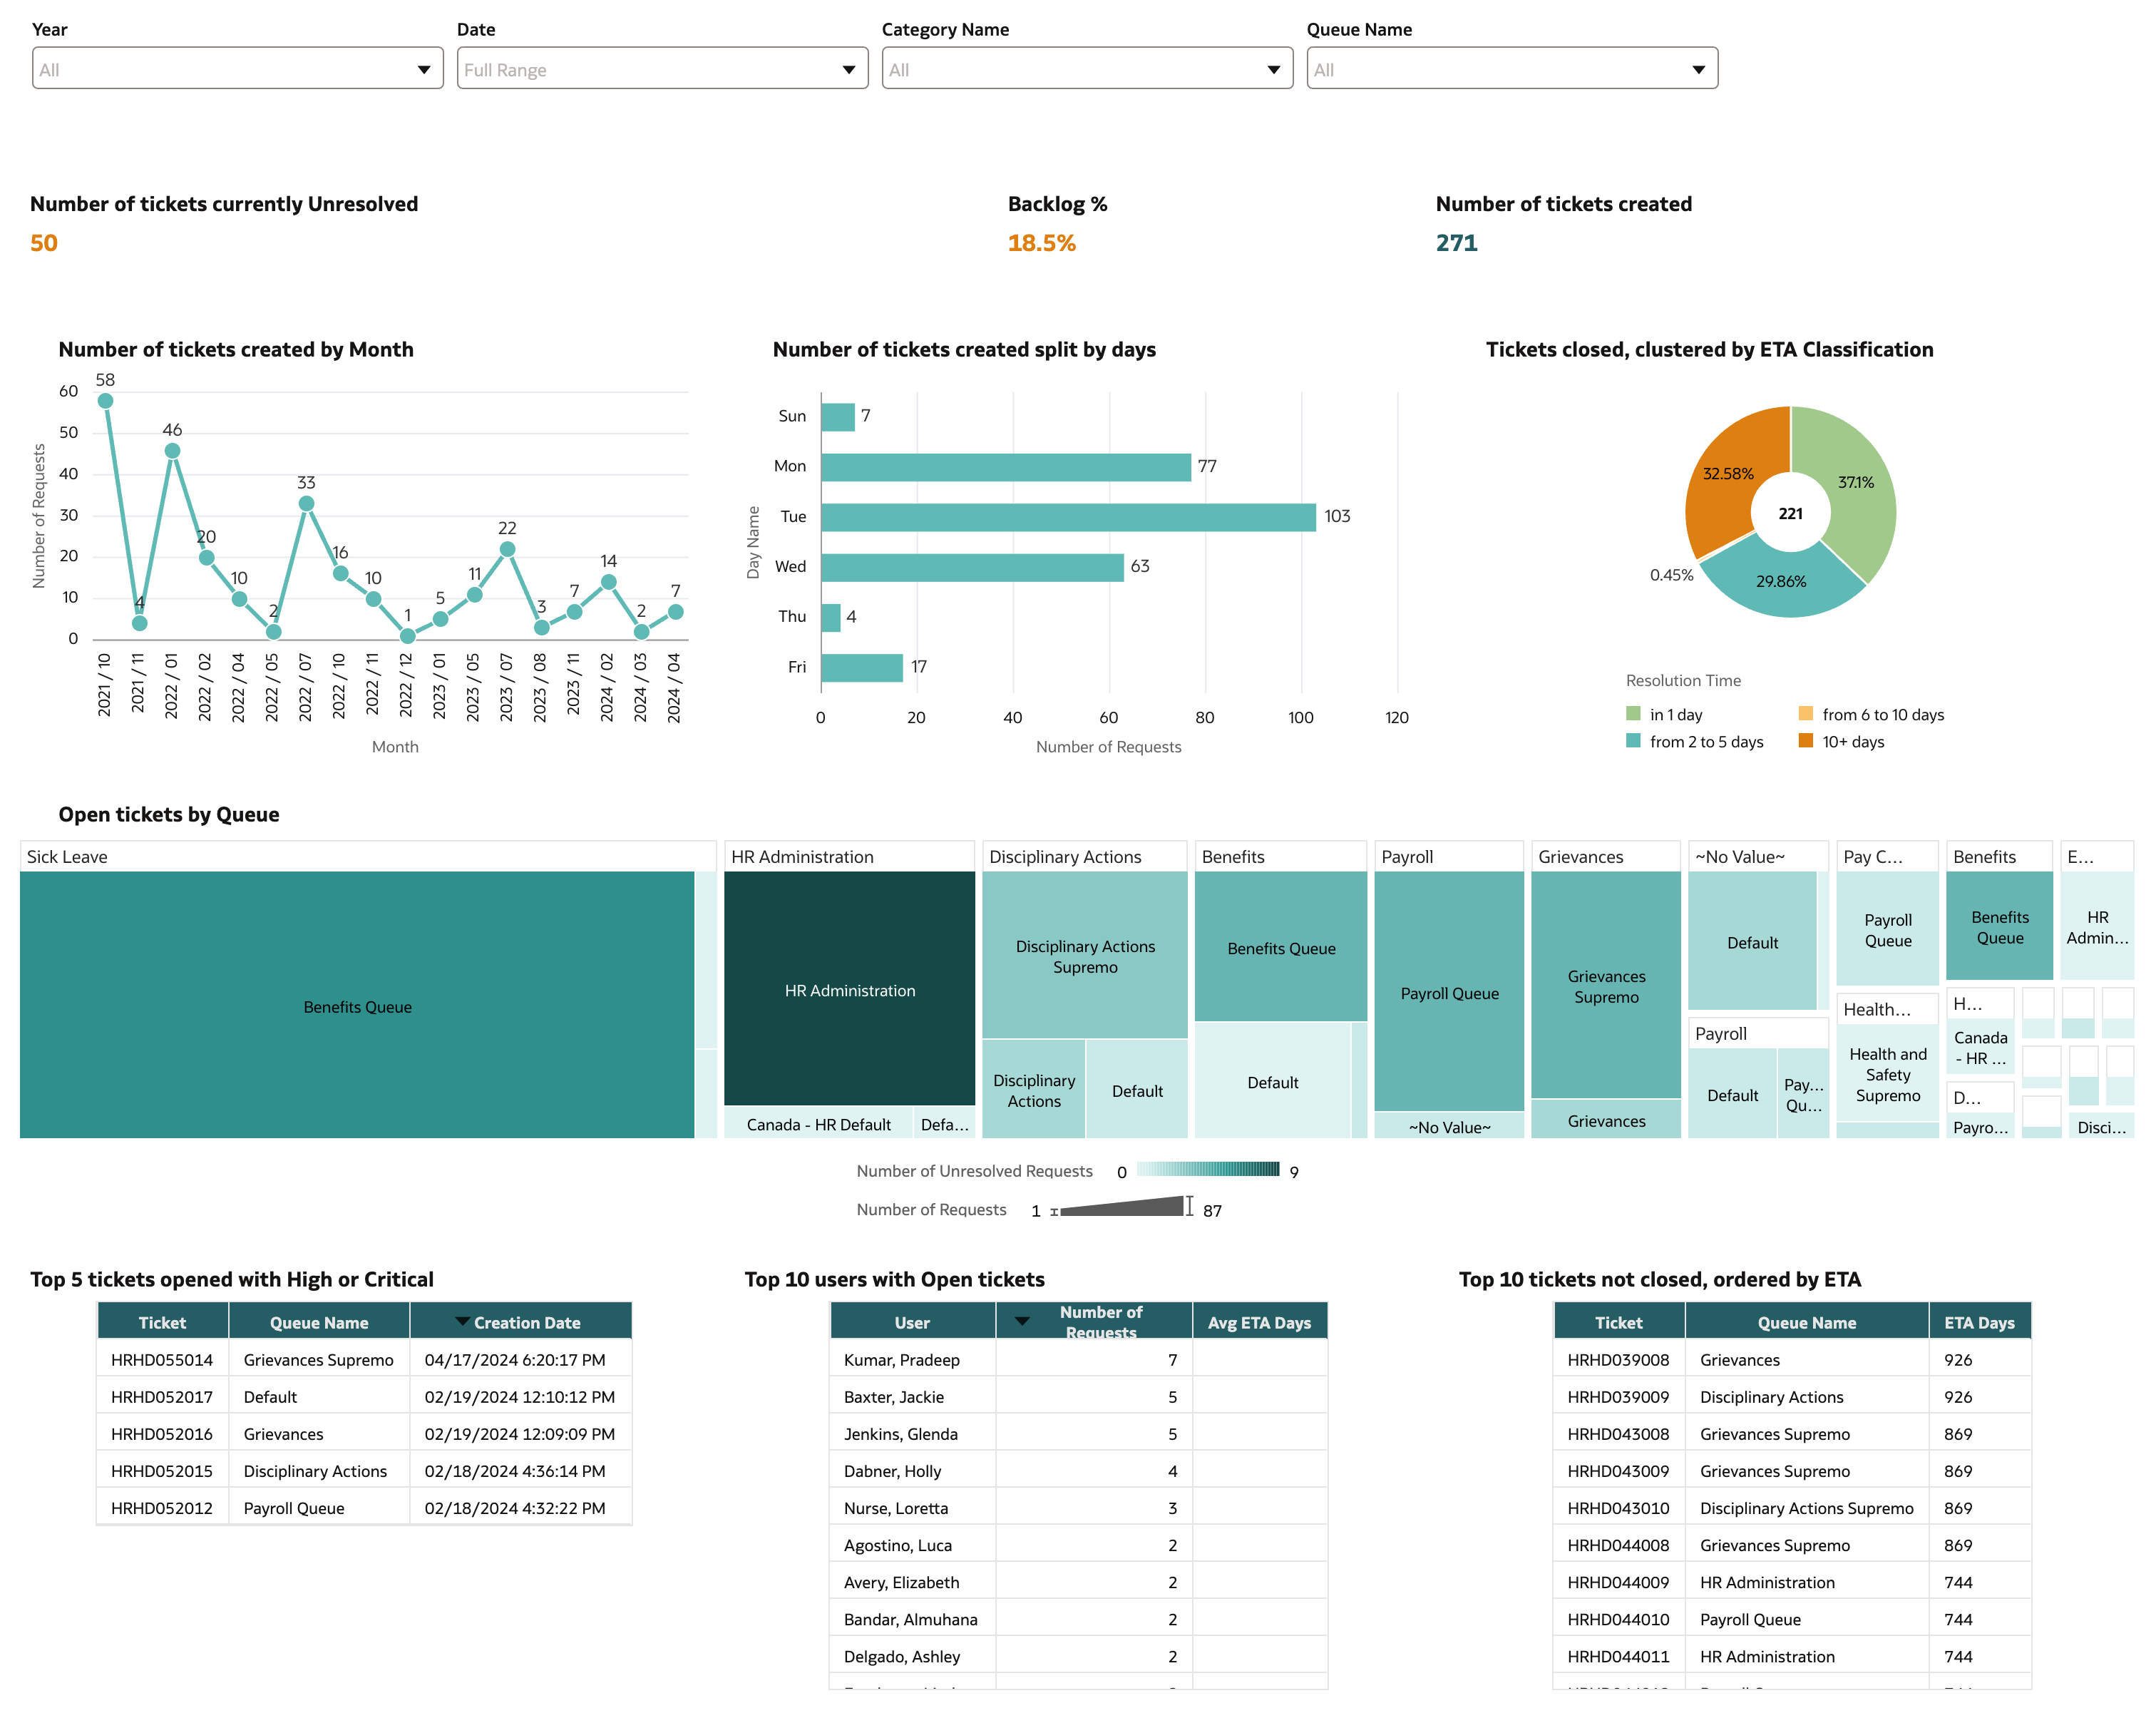
- Number of tickets created
- Number of tickets currently unresolved
- Backlog %
- Number of tickets created by month
- Number of tickets created split by days of the week
- Tickets closed, clustered by ETA classification
- Open tickets by queue and category
- Top 5 tickets opened with High or Critical
- Top 10 users with open tickets
- Top 10 tickets not closed, ordered by ETA
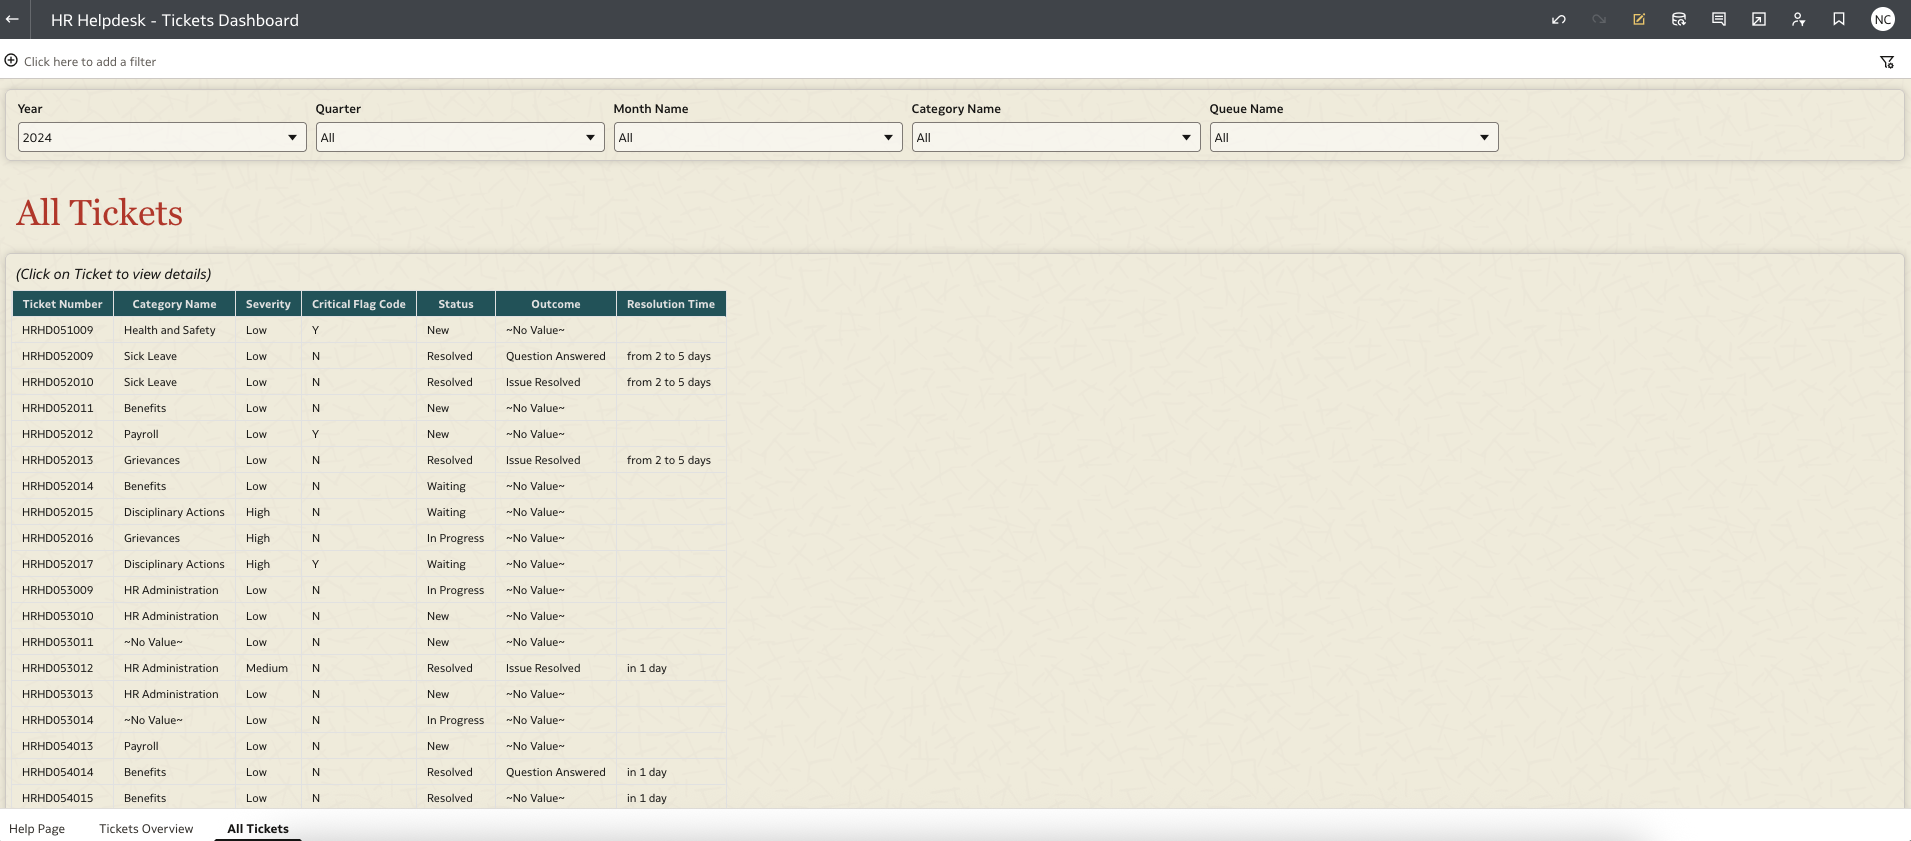
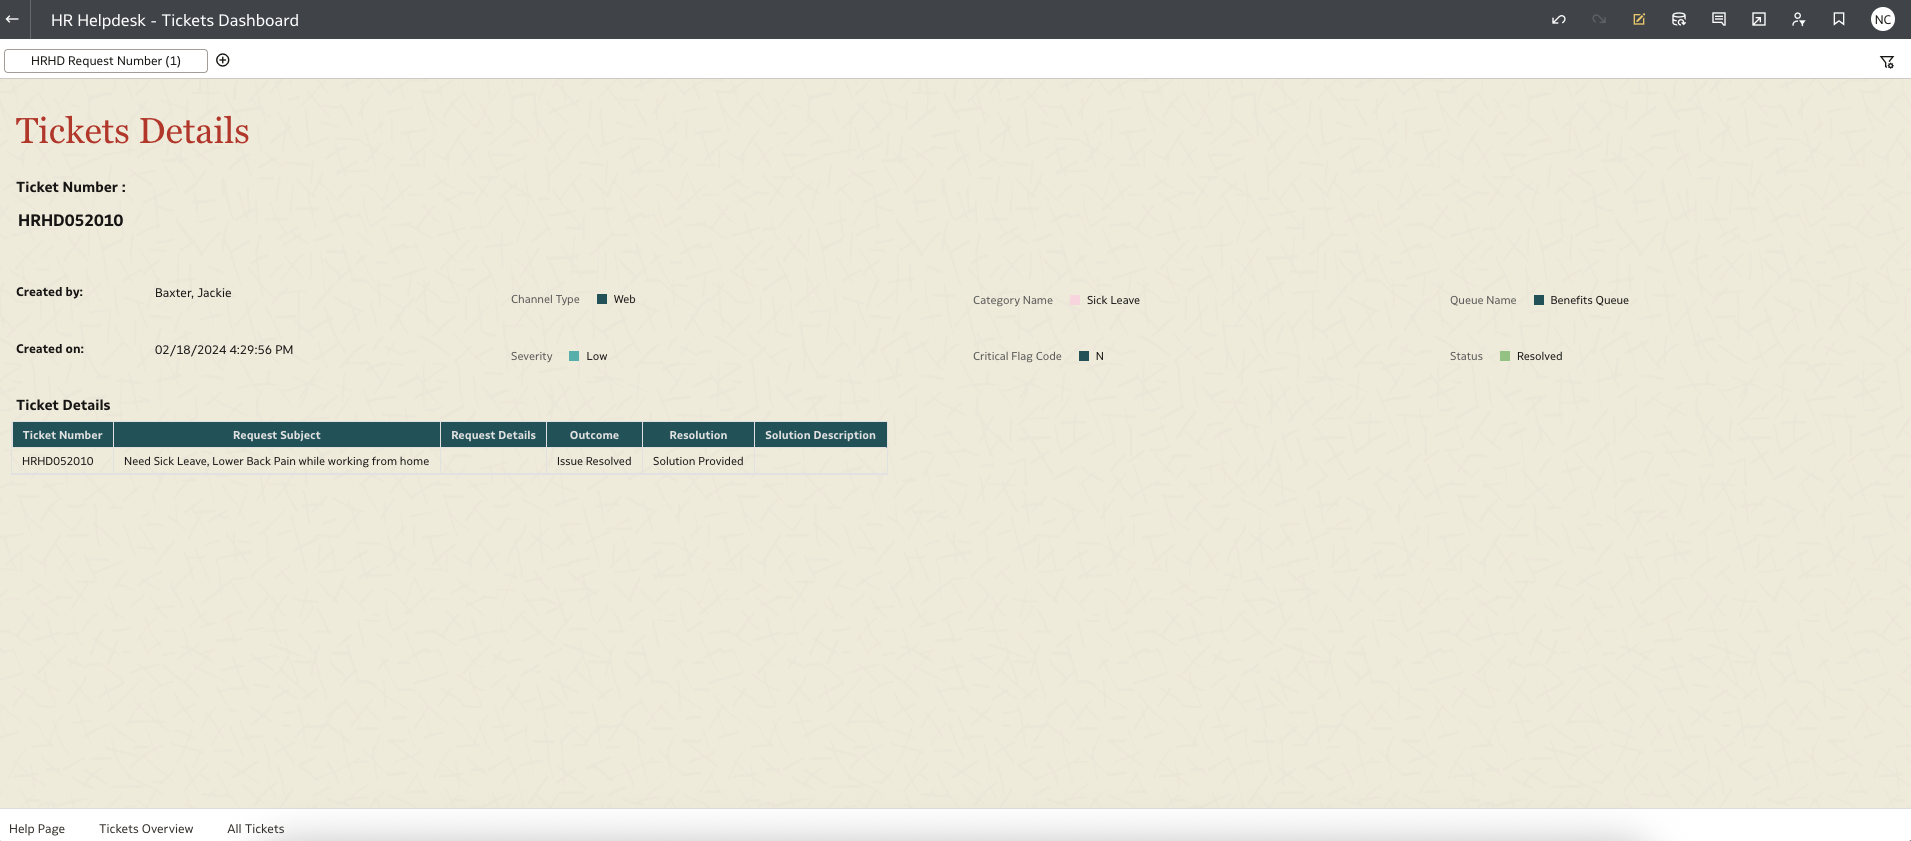
Drill down to All tickets details
Right click on tickets to drill down to view all details about a ticket