Happy to share the Dashboard we created for the World Solar Car Championship! An epic race bringing together the brightest minds in solar innovation. Oracle was proud to partner with the University of Michigan as they represented the U.S. as national champions. 🇺🇸
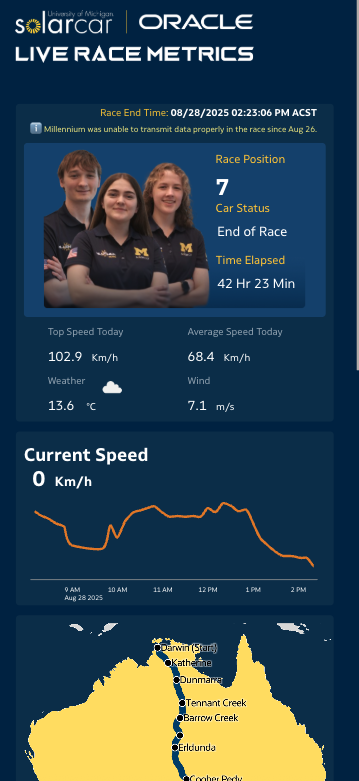
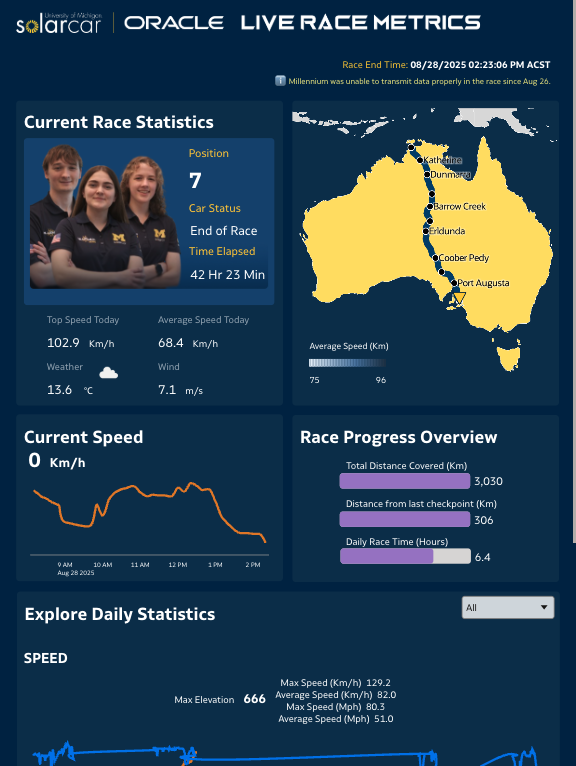
Oracle teamed up with the University of Michigan to power a live race tracker built with Oracle Analytics Cloud, enabling fans across the globe to follow the team's progress in real time throughout the week.
Key Oracle Analytics Features:
We leveraged Freeform layout and Responsive Canvas Editor features to deliver both a unique, outstanding design and a fully responsive experience.
With Freeform, we can position visualizations and design elements anywhere on the dashboard. With Responsive Canvas Editor, we can dynamically reposition all visualizations and design components based on screen size.
It was a team effort @Carrie Nielsen-Oracle @Ahmed Awan-Oracle @Anita Gupta Kashika Puri @Manpreet Shahi @Veera Raghavendra @Rao Koka @Brian Macdonald