Categories
- All Categories
- Oracle Analytics and AI Learning Hub
- 39 Oracle Analytics and AI Sharing Center
- 20 Oracle Analytics and AI Lounge
- 275 Oracle Analytics and AI News
- 50 Oracle Analytics and AI Videos
- 16.2K Oracle Analytics and AI Forums
- 6.4K Oracle Analytics and AI Idea Labs
- Oracle Analytics and AI User Groups
- 102 Oracle Analytics and AI Trainings
- 17 Oracle Analytics and AI Challenge
- Find Partners
- For Partners
Welcome to the Oracle Analytics Community: Please complete your User Profile and upload your Profile Picture
Utilities: Demand prediction analytics

InsightSeeker-Oracle
Rank 5 - Community Champion

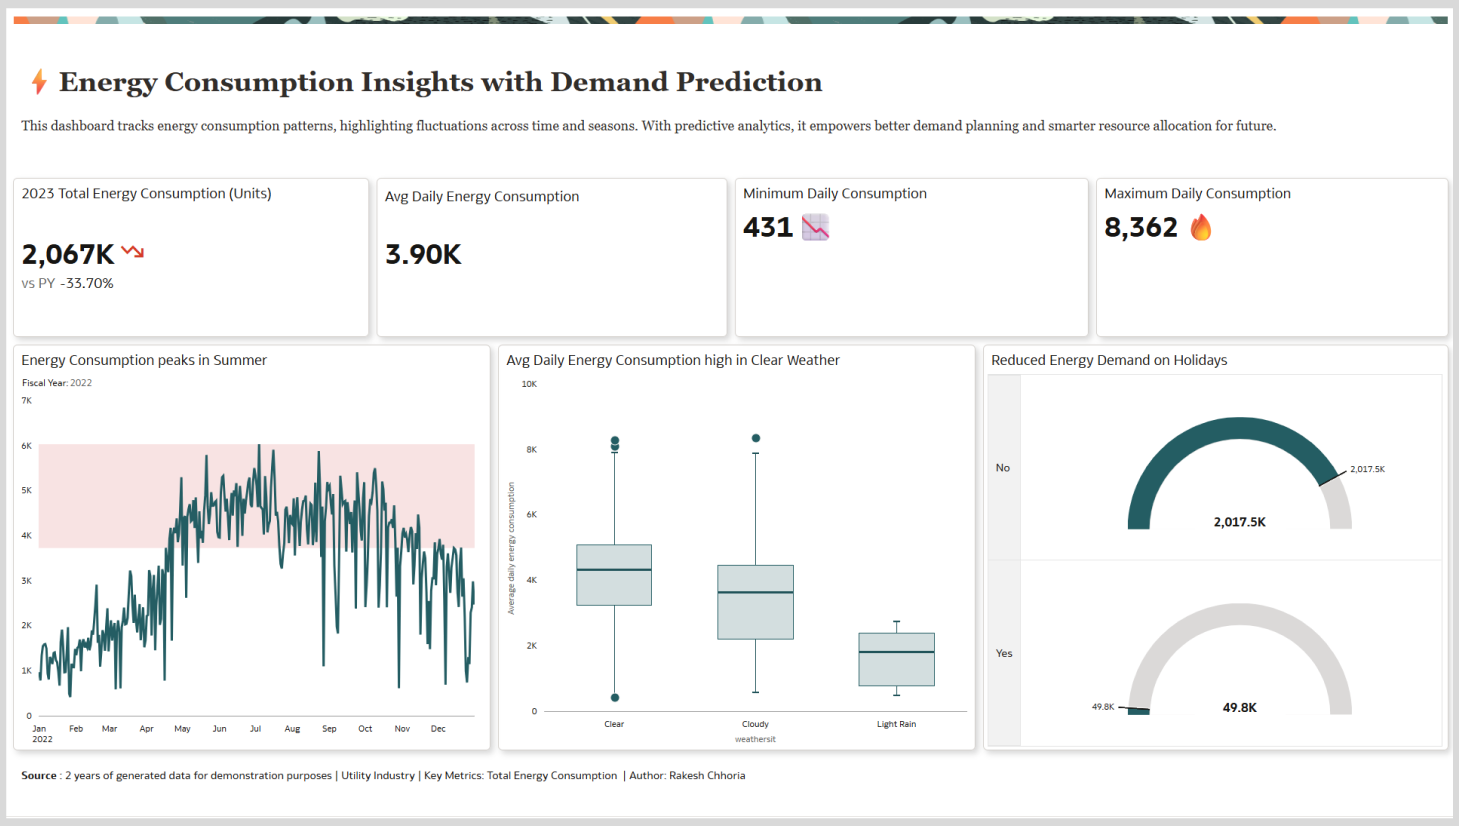
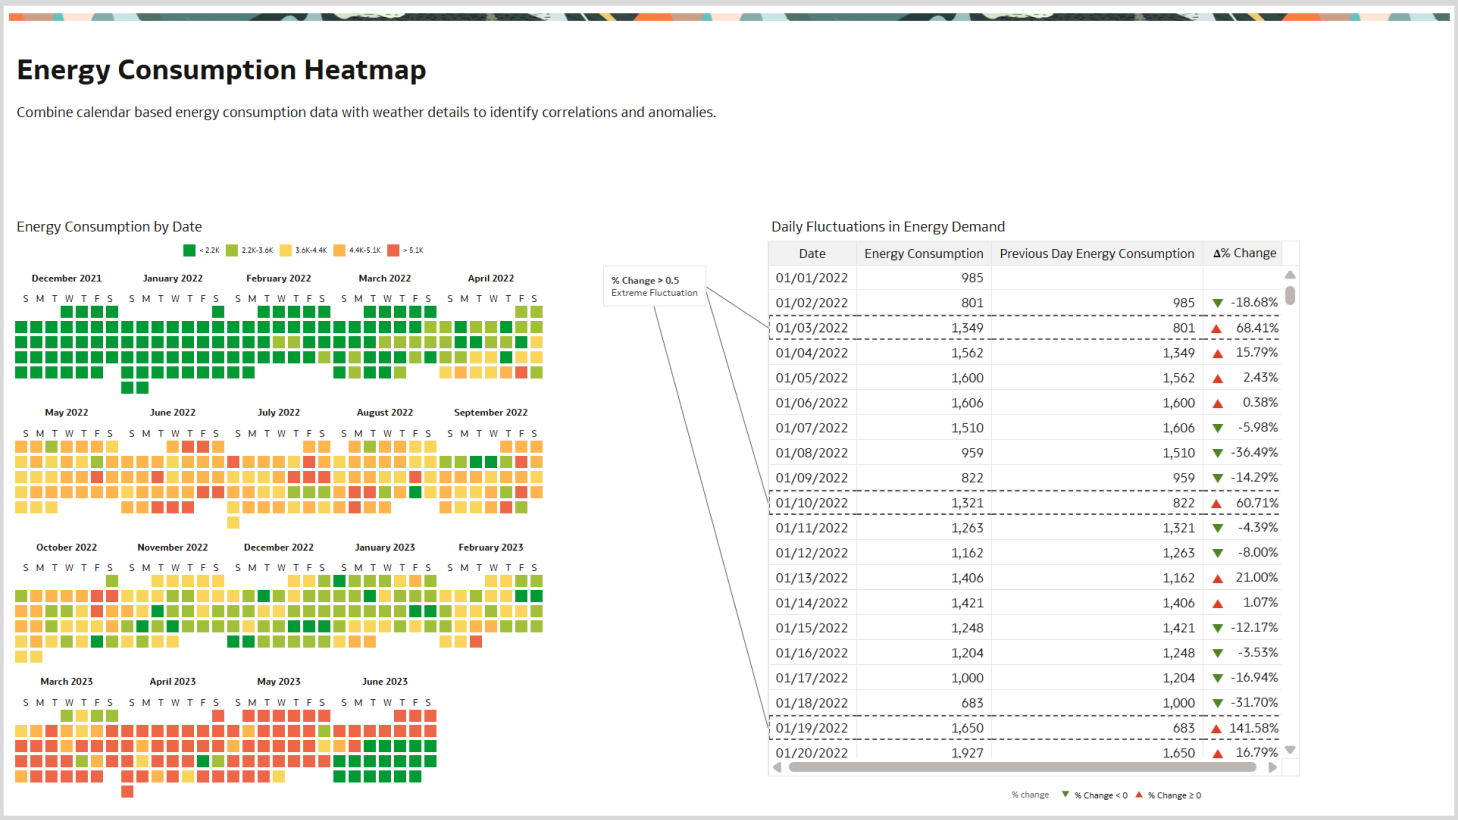
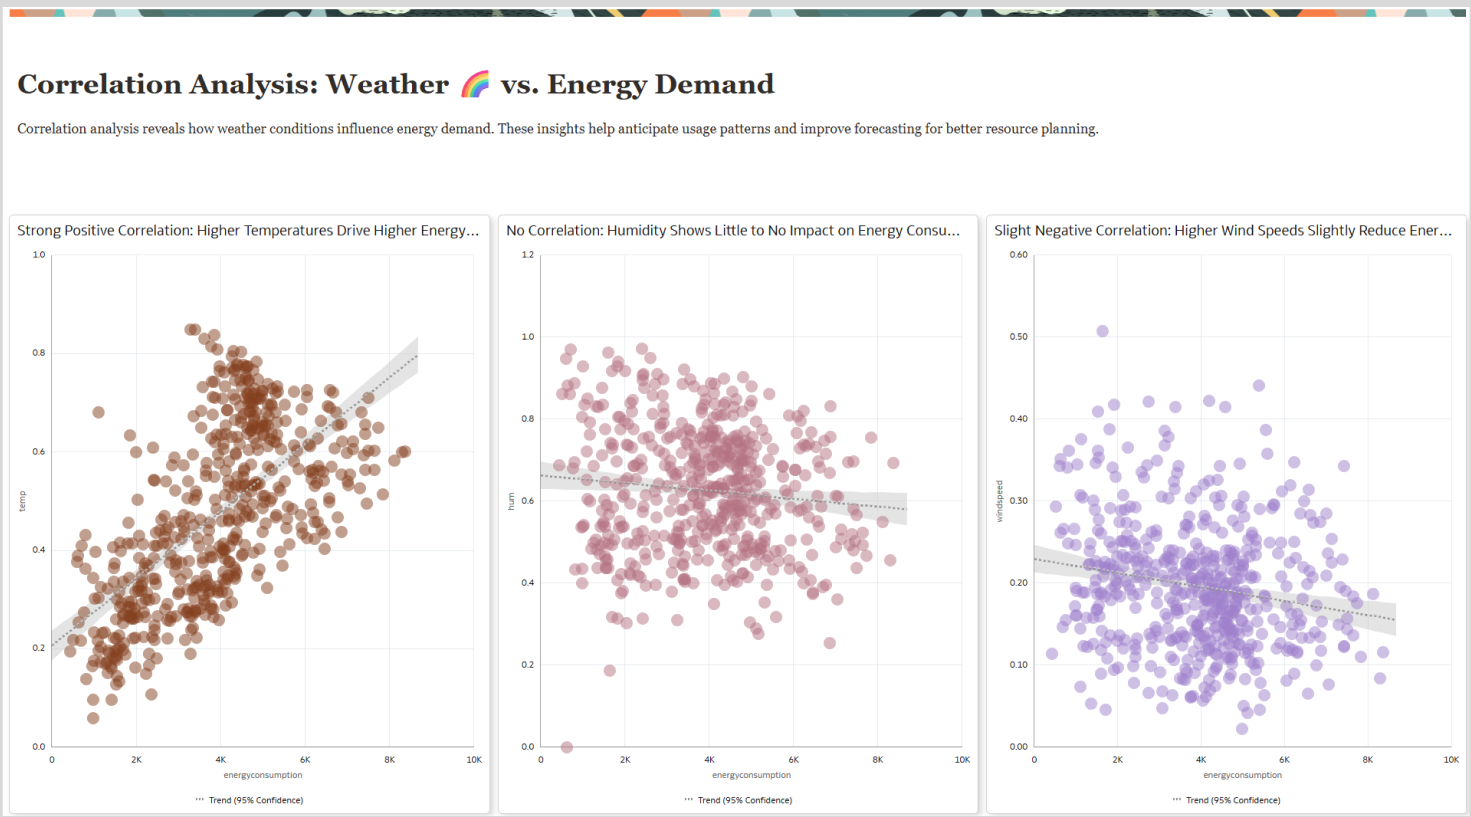
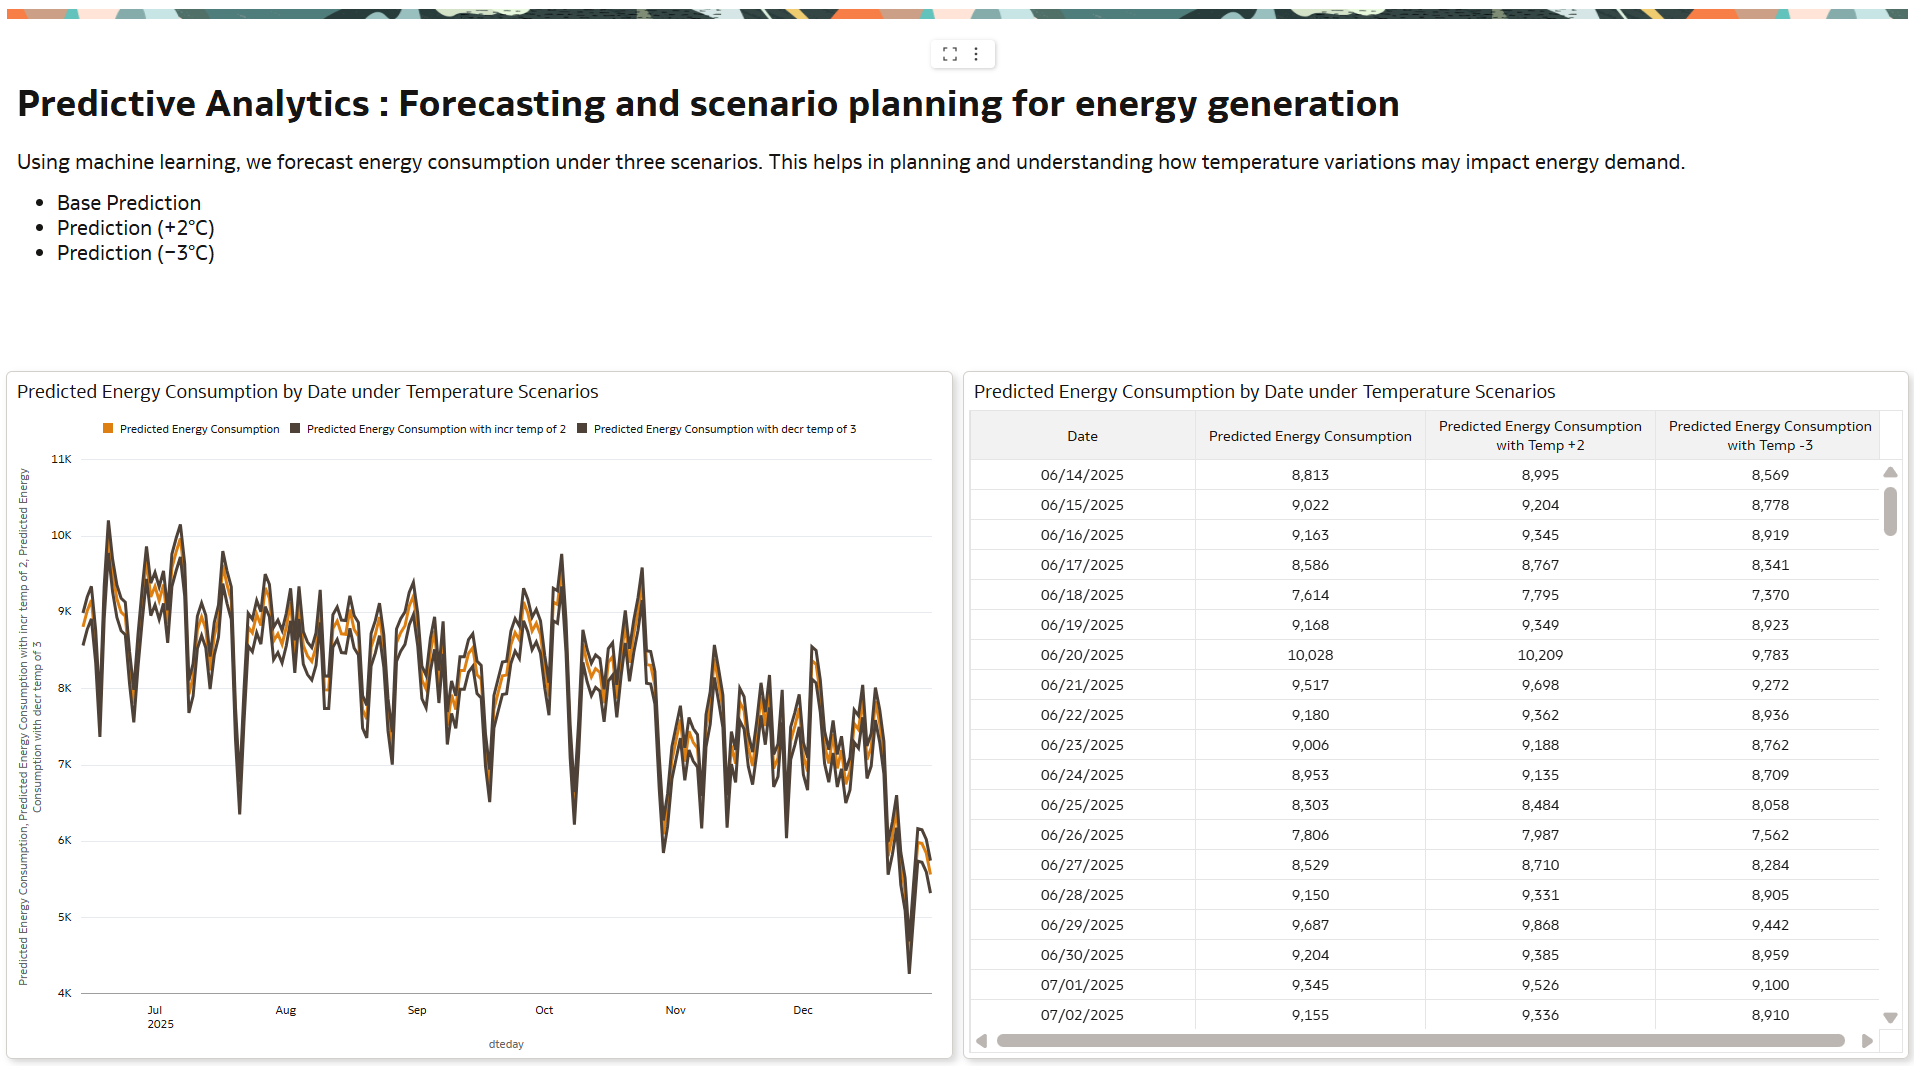
Discover how AI-powered analytics helps utilities forecast demand, optimize generation and ensure reliable, efficient energy delivery.
Tagged:
5
Comments
-
Great one. Simple and effective.
1 -
Great Visualization.
1


