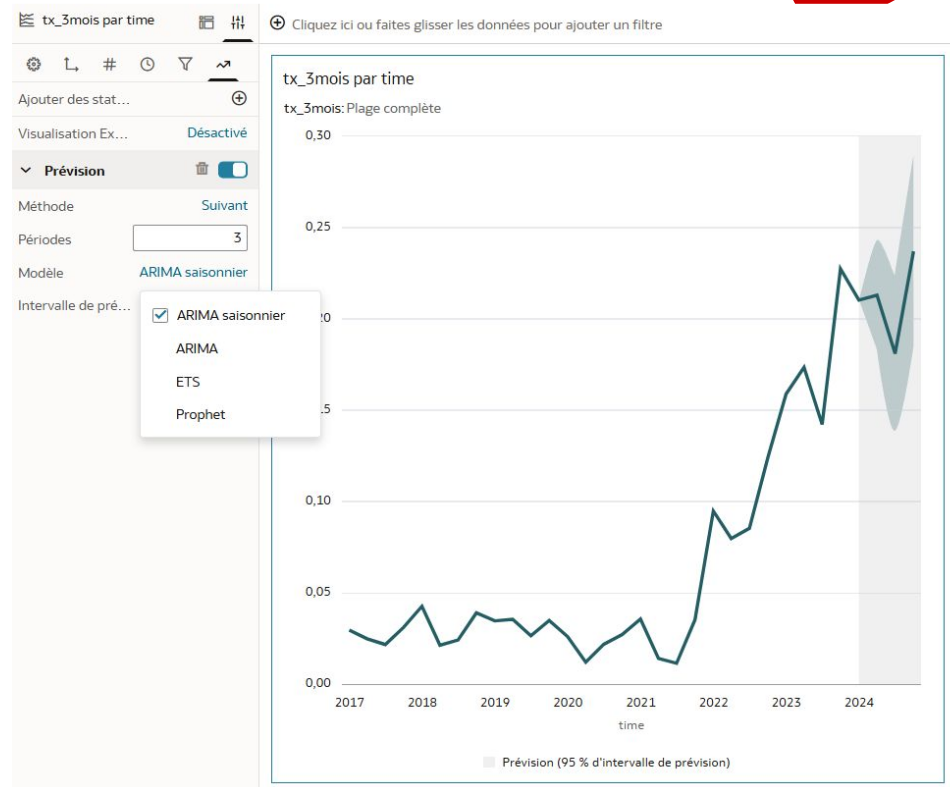
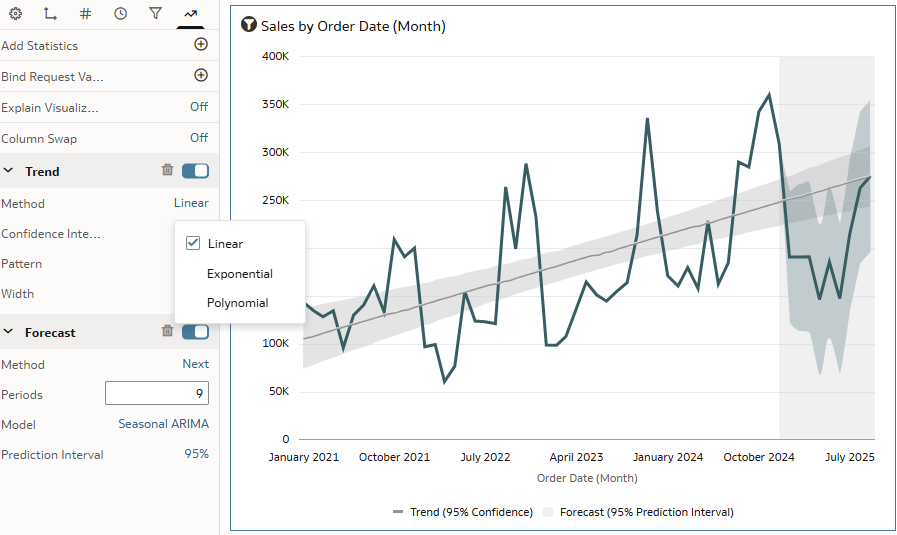
Added linear regressions in the Analysis section, then forecast for certain visualizations such as curves (see the example on the right). In addition to the forecasts already present such as ARIMA, SARIMA, ETS, etc.
Yes this would be useful and some additional regression lines in other visualizations would also be helpful, along with an AB line
Thanks @Thomas HYRIEN and @Brendan T
currently using right-click trendline, you can add a linear(regression)/poly/expo trendline on the viz directly, see below, that should already help with the initial question. As for slope and intercept (was that your question ?) these will are provided when the trendline is built on a scatter plot. But when the trendline is using date, X is then normalized to a sequential number and A&B become conventions (funtionally meaningless). Let me know if this does not answer your question
Thanks
Thanks Philippe
Hi,
Thanks,
We would like some additional forecast models in the list in addition to ARIMA, SARIMA, ETS, etc.
While additional algorithms are being requested there is a fuller list of what could be added (some already there)
Autoregression (AR): Predicts future values based on past values of the same series.
Right now, OAC offers pre-built pages and watchlists related to NSAW. At our University, we do not need these pages, and we want to delete them entirely. We've been told in response to our SR that all we can do is keep "Access" limited to only the default admin and sysAdmin roles. This prevents regular users from seeing…
It would be nice to have a way to right click on an object (subject Area, Column, Calculation, etc.) in the Data Panel and show where that object is referenced in a workbook = canvas, visualization, filter, calculation, data action, etc.) In Workbooks with multiple canvases and multiple subject areas, we are left to hover…
We want to automate the workbook export to .dva file and import this into another OAC instance using REST API, The goal is an OCI DevOps pipeline that can promote (a) a whole folder, (b) a single workbook, or (c) several workbooks in one run to another OAC instance, and print a status result at the end. Blocker: Export and…
When Oracle Analytics AI features find an anomaly, trend or key driver, let authors save those results as a dataset or subject area. Each run would add rows with the metric, the date found, the expected versus actual value, the severity, the main drivers and the filters applied. Authors could then build workbooks, schedule…
We use the snapshot to update AppRoles members. But we would like to disable catalog content to have smaller snapshots and create snapshots faster.