Oracle Analytics Cloud and Server Idea Lab

Welcome to the Oracle Analytics Community: Please complete your User Profile and upload your Profile Picture

Enhancement Request: Dynamic Column Display Based on Checkbox Selection in Table Visualization

15
Views
3
Comments

Enhancement Request: Dynamic Column Display Based on Checkbox Selection in Table Visualization

Description:
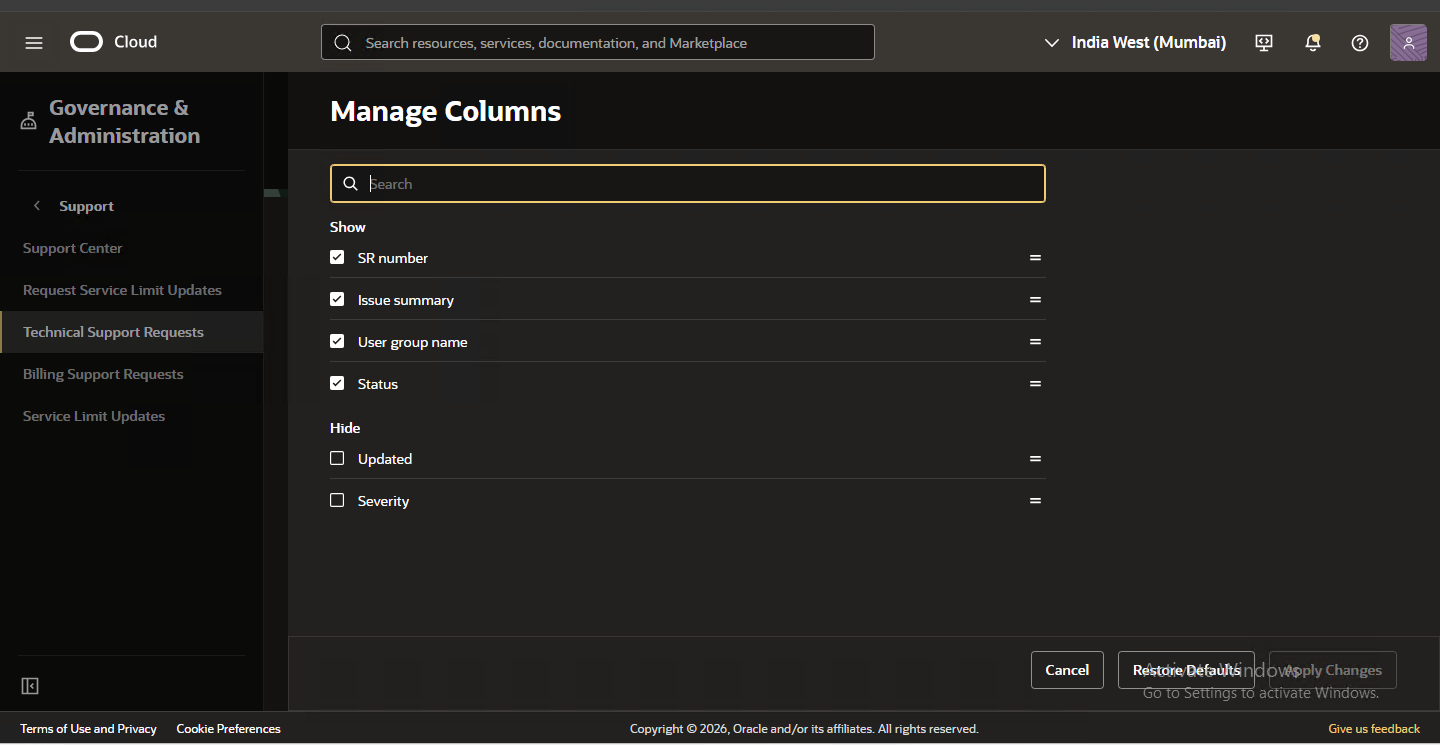
We would like to have the ability in OAC to dynamically show or hide columns in a table visualization based on user checkbox selections (or similar interactive controls).

Currently, users must manually edit the visualization or use filters to limit rows, but there is no native way to control the visibility of specific columns interactively at runtime.

Example Use Case:

  • A dashboard has multiple optional metrics (e.g., Revenue, Margin, Forecast, Variance).
  • The user should be able to select checkboxes (e.g., "Show Revenue", "Show Margin") to control which columns appear in the table.
  • The table visualization should automatically update based on those selections — hiding unchecked columns and showing checked ones.

Current Workaround:

  • Creating multiple table visualizations for different combinations of columns, and using canvas visibility conditions to show/hide them.
  • This approach is inefficient, increases maintenance complexity, and impacts performance.

Proposed Enhancement:
Add functionality in OAC that allows:

  1. Table columns to be dynamically shown or hidden based on the value of a dashboard or variable (e.g., Boolean checkbox or parameter).
  2. A built-in UI mechanism to bind column visibility to dashboard controls (similar to conditional formatting or filter actions).

Business Impact:

  • Improves user experience and interactivity.
  • Reduces dashboard clutter and maintenance effort.
  • Makes OAC dashboards more flexible and comparable to BI tools that support runtime column toggling.

Priority: High
Requested For: Upcoming OAC releases
Reference: [Optional] Demonstration video:

2
2 votes

Submitted · Last Updated

Comments

  • Sushant Mishra
    Sushant Mishra Rank 6 - Analytics & AI Lead

    Sounds like an interesting use case, however I suppose we can take the advantage of filters and see if we can map the columns of the table to them. Have to check if that is the case. If not then this is a good to have enhancement.

  • User_8JAXR
    User_8JAXR Rank 2 - Community Beginner

    Could you please suggest steps to implement this functionality or propose any workarounds? It would be helpful to implement a temporary solution until this feature is officially rolled out.

  • User_8JAXR
    User_8JAXR Rank 2 - Community Beginner

    I would like to request that Oracle Analytics Cloud (OAC) prioritize the development and rollout of the feature to dynamically show or hide columns in a table visualization based on user selections, such as checkboxes or similar interactive controls.

    This feature is essential for improving dashboard interactivity, reducing maintenance complexity, and enhancing user experience by allowing users to customize the visibility of table columns without requiring manual edits or complex workarounds. Currently, the only option available is to create multiple visualizations with different column combinations, which impacts performance and increases dashboard clutter.

    The ability to bind column visibility to dashboard controls (similar to how conditional formatting works) would make OAC dashboards more flexible, user-friendly, and competitive with other BI tools that already support runtime column toggling.

    Given its high business impact, I kindly request that this enhancement be fast-tracked for development and rolled out in an upcoming release.

    Thank you for considering this request.