Modern analytics often requires visualizing massive geographic datasets, such as postal codes, administrative districts, or land parcels, which can contain thousands of intricate geometries. Traditionally, rendering these full geometries has been resource-intensive, requiring every shape to be downloaded and processed by the browser.
What are Vector Map Layers?
At their core, vector map layers are a web-optimized method for delivering geographic data by dividing a map into a small, compressed grid system. Unlike traditional GeoJSON layers that require the browser to download and process every coordinate of every shape before anything appears, vector tiles are streamed only for the specific area and zoom level currently in the map view.
These layers are composed of two distinct but complementary data streams:
- PBF (Protocolbuffer Binary Format): This is a highly compressed, binary representation of the geometries. It is designed purely for rendering speed, allowing the browser to draw shapes almost instantly as they are received.
- GeoJSON Metadata: While PBF handles the "look" of the map, it lacks the context for advanced analytics. This secondary metadata stream provides feature extents (bounding boxes) and interior points (centroids) used for interactive behaviors like label placement, automatic focusing, and dataset binding
The performance of vector map layers is not just a front-end trick; it is powered by deep integration within the Oracle AI Database and Oracle REST Data Services (ORDS).
- On-Demand Spatial Tile Generation Vector tiles are not precomputed static files; they are generated dynamically at the moment of request. When a user pans or zooms in Oracle Analytics, the map client sends a request following a standard coordinate pattern (z/x/y) to an ORDS endpoint. The database then performs a spatial intersection query to determine which polygon geometries intersect that specific tile envelope.
- Rendering vs. Interaction Logic Oracle Analytics splits the workload between the two endpoints to maximize efficiency:
- Rendering (PBF): As you zoom, the map client fetches only the tiles necessary for that view, reducing the network load compared to downloading a massive, singular geometry file.
- Interaction (GeoJSON): This metadata is loaded once per session during layer initialization. It allows Oracle Analytics to know exactly where a feature is (even if its specific tile hasn't loaded yet), enabling the "Auto Focus" and "Filtering" behaviors that users expect from a high-end BI tool.
- Intelligent Caching and Lifecycle Because many users often explore the same geographic regions, the system utilizes a built-in caching mechanism (SDO_UTIL.ENABLE_VECTORTILE_CACHE). Once a tile is generated for the first time—which may take a few moments for complex datasets—it is stored in the cache and retrieved instantly for all subsequent sessions, including those by different users
6-Step Implementation Guide
To transition from traditional geometry-based mapping to vector tiles, follow these six essential steps:
- Prepare Spatial Data Store your dataset in the Oracle AI Database using SDO_GEOMETRY objects. It is vital to ensure that geometries are validated—checking for self-intersections or boundary gaps—to prevent rendering errors.
- Publish Vector Tiles via ORDS Vector tiles are generated on demand, not precomputed. Create an ORDS module that translates tile requests into spatial calls using the function SDO_UTIL.GET_VECTORTILE. This returns geometries in a compact PBF (Protocolbuffer Binary Format), which is highly optimized for map rendering.
- Publish Bounding Box Content Because vector tiles are optimized for speed, they do not contain enough information for complex interactions like label placement or automatic zooming. You must provide a GeoJSON endpoint containing metadata for each feature, including:
- A minimum bounding rectangle (MBR) for zoom behavior.
- An interior point (centroid) for accurate label placement.
- A unique feature key (e.g., ZIP code or ID) to bind your dataset attributes to the map features.
- Enable Tile Caching For production environments, use SDO_UTIL.ENABLE_VECTORTILE_CACHE. Caching prevents the database from regenerating the same tiles repeatedly, which reduces compute overhead and improves dashboard responsiveness under heavy user loads.
- Register the Layer in Oracle Analytics Navigate to the Oracle Analytics Console, select Maps, and then the Data Layers tab. Add a new Vector Tile layer by providing the URLs for both your PBF vector source endpoint and your GeoJSON bounding box endpoint.
- Visualize and Interact Once registered, the layer is available across your workbooks. Simply:
- Create a map visualization.
- Drag your geographic key column (e.g., GEOID20) to the Category (Location) target.
- In the layer properties, select your custom vector layer.
- Apply metrics to the Color target to create thematic maps.
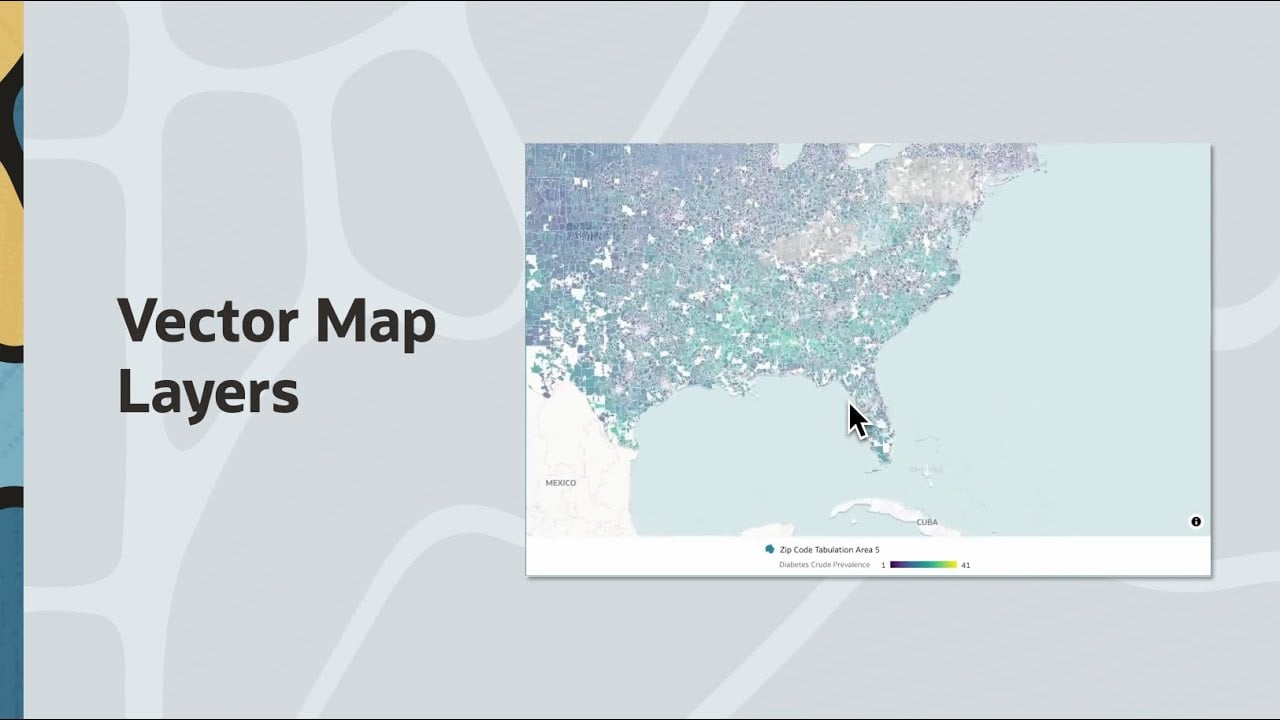
To see a live demonstration of how these layers behave and how they are configured within the platform, watch the video below
Learn more about Vector Map Layers →


