1. Which dataset did you use?
Life Science: Case Info dataset provided by Oracle (although I had to export it to amend some weird dates that was causing issues on joints).
2. How did you analyze or prepare the data?
I used Oracle Analytics Auto-Insights and Explain to surface key patterns and understand the data structure. I also leveraged external AI assistance to explore the dataset from a pharmacovigilance industry perspective, ensuring the analysis and metrics aligned with healthcare standards and the expectations of the intended audience, as I am not a domain expert in healthcare.
3. Who is the intended audience for your visualization?
Pharmacovigilance and Drug Safety managers responsible for monitoring adverse event cases and ensuring regulatory compliance.
4. What is your visualization about, and what question or problem does it address?
My visualization analyzes adverse event medical cases to help Drug Safety managers monitor and act on critical pharmacovigilance metrics. The dashboard is structured across four dedicated sections:
- Executive Overview — high-level summary of case volumes, seriousness, and HCP Reporter Rate
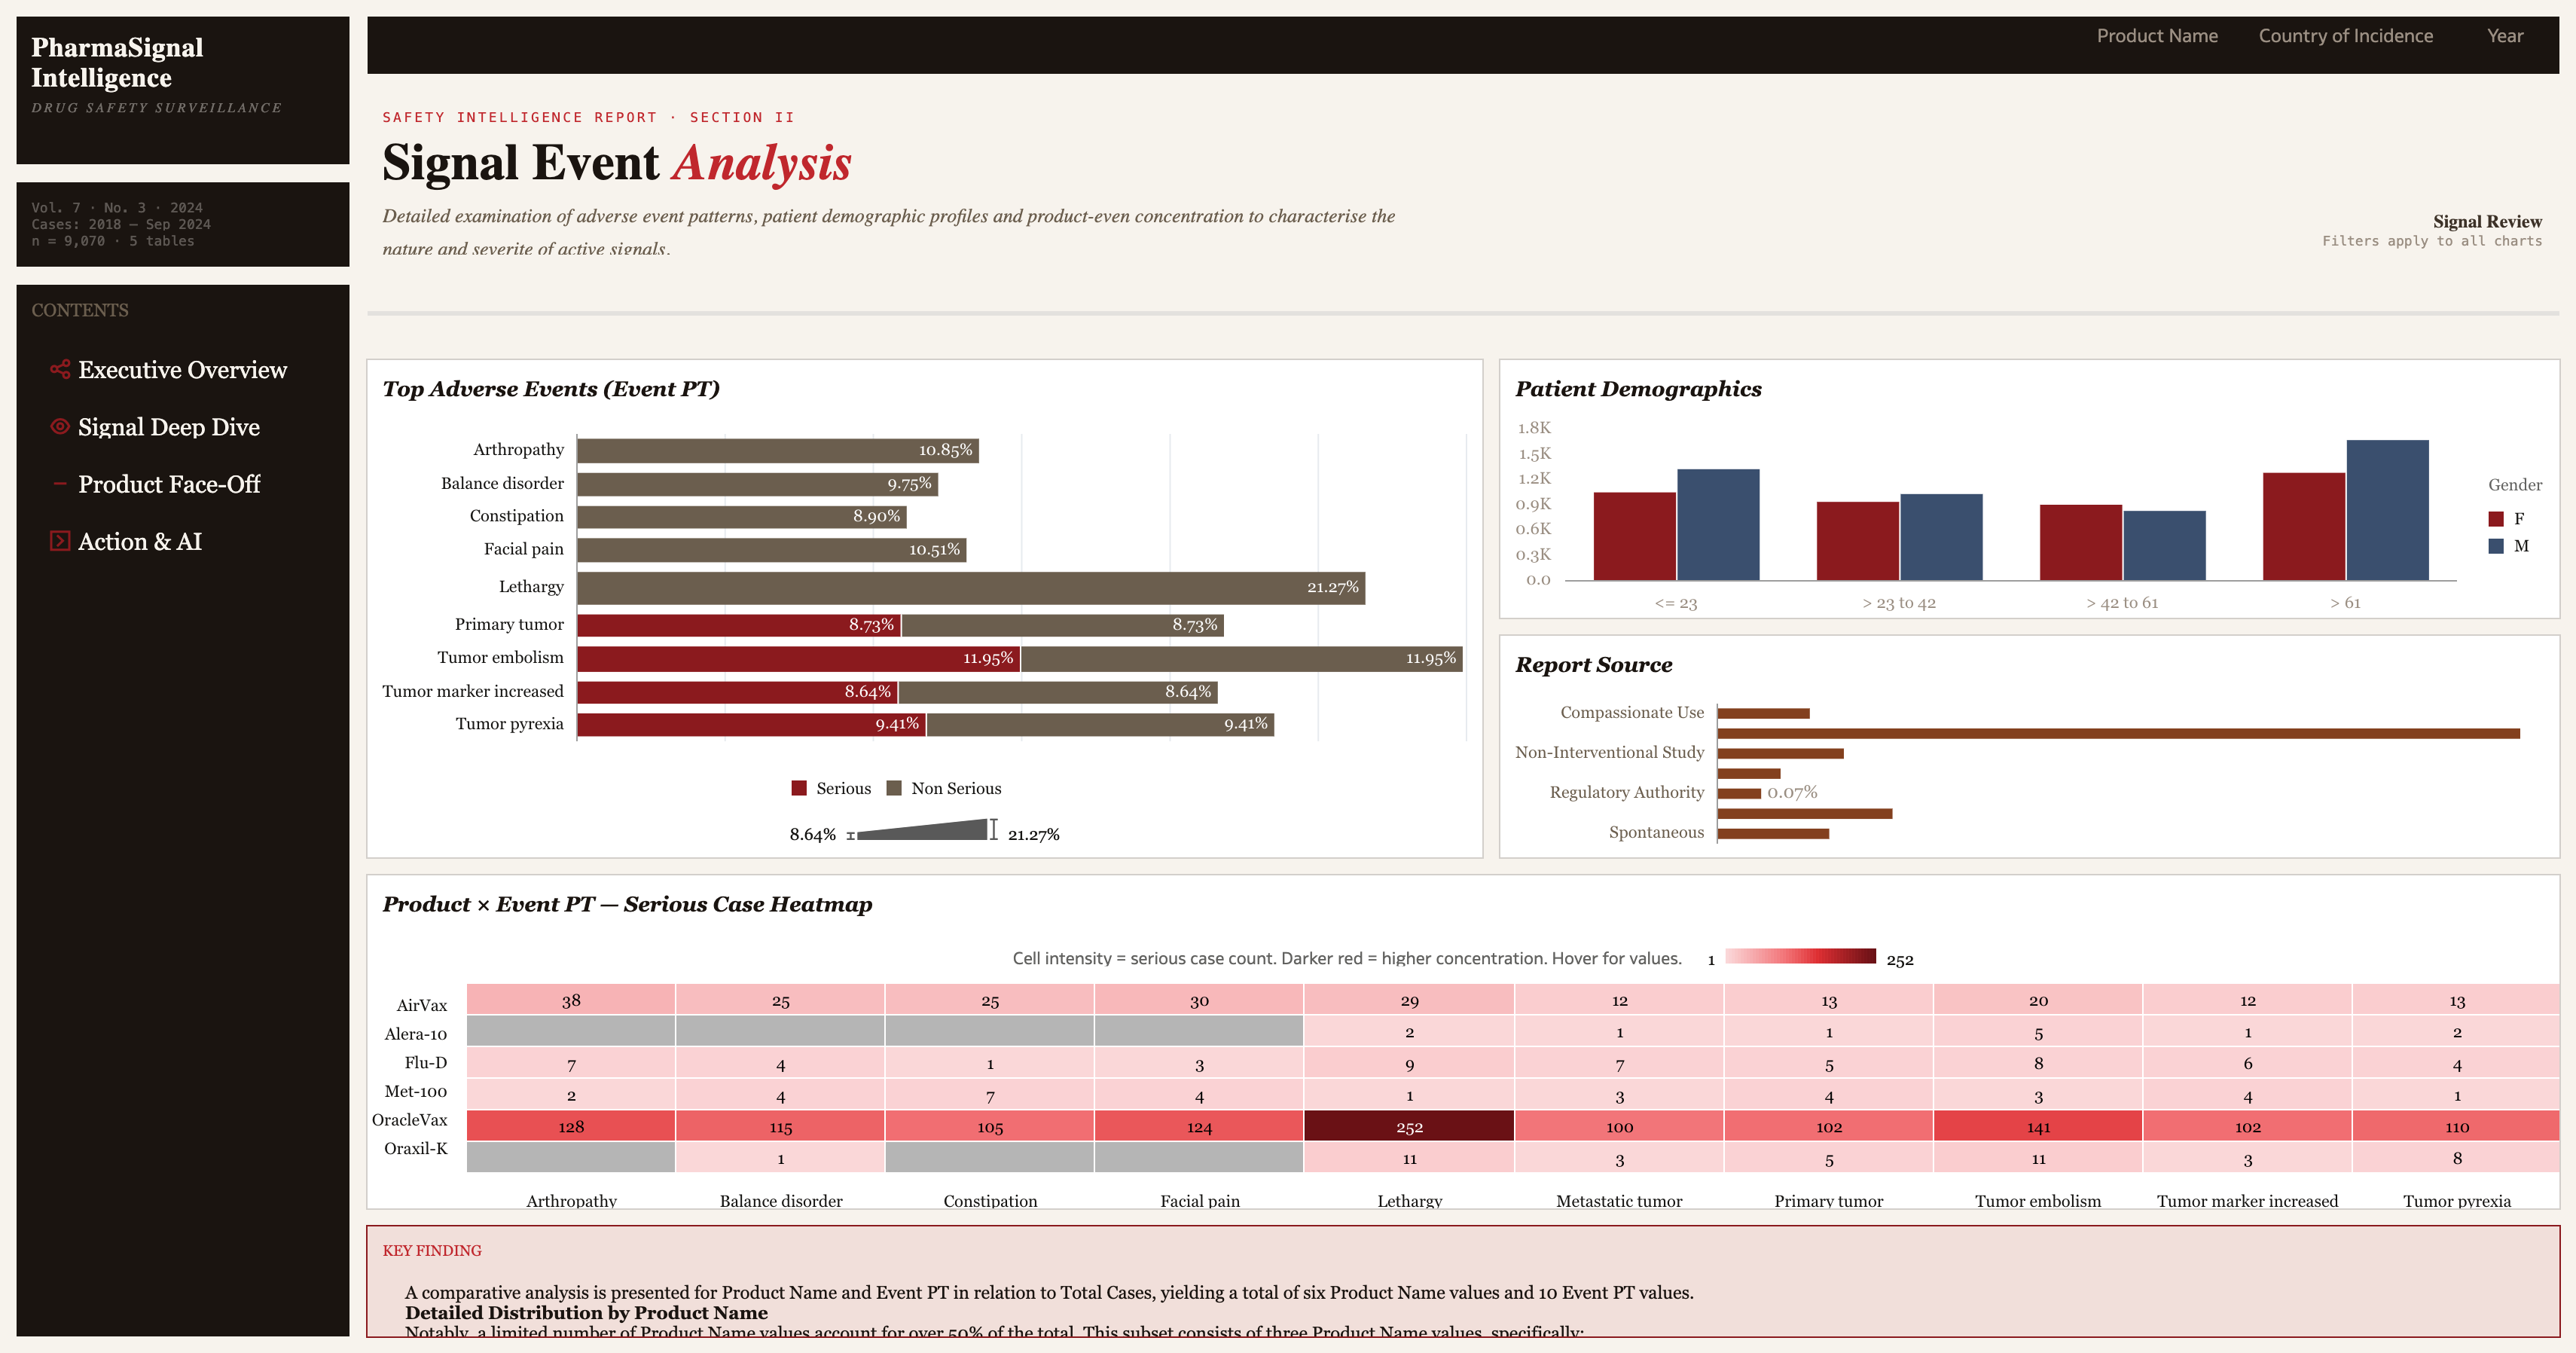
- Signal Deep Dive — detailed exploration of adverse events, onset dates, and event patterns
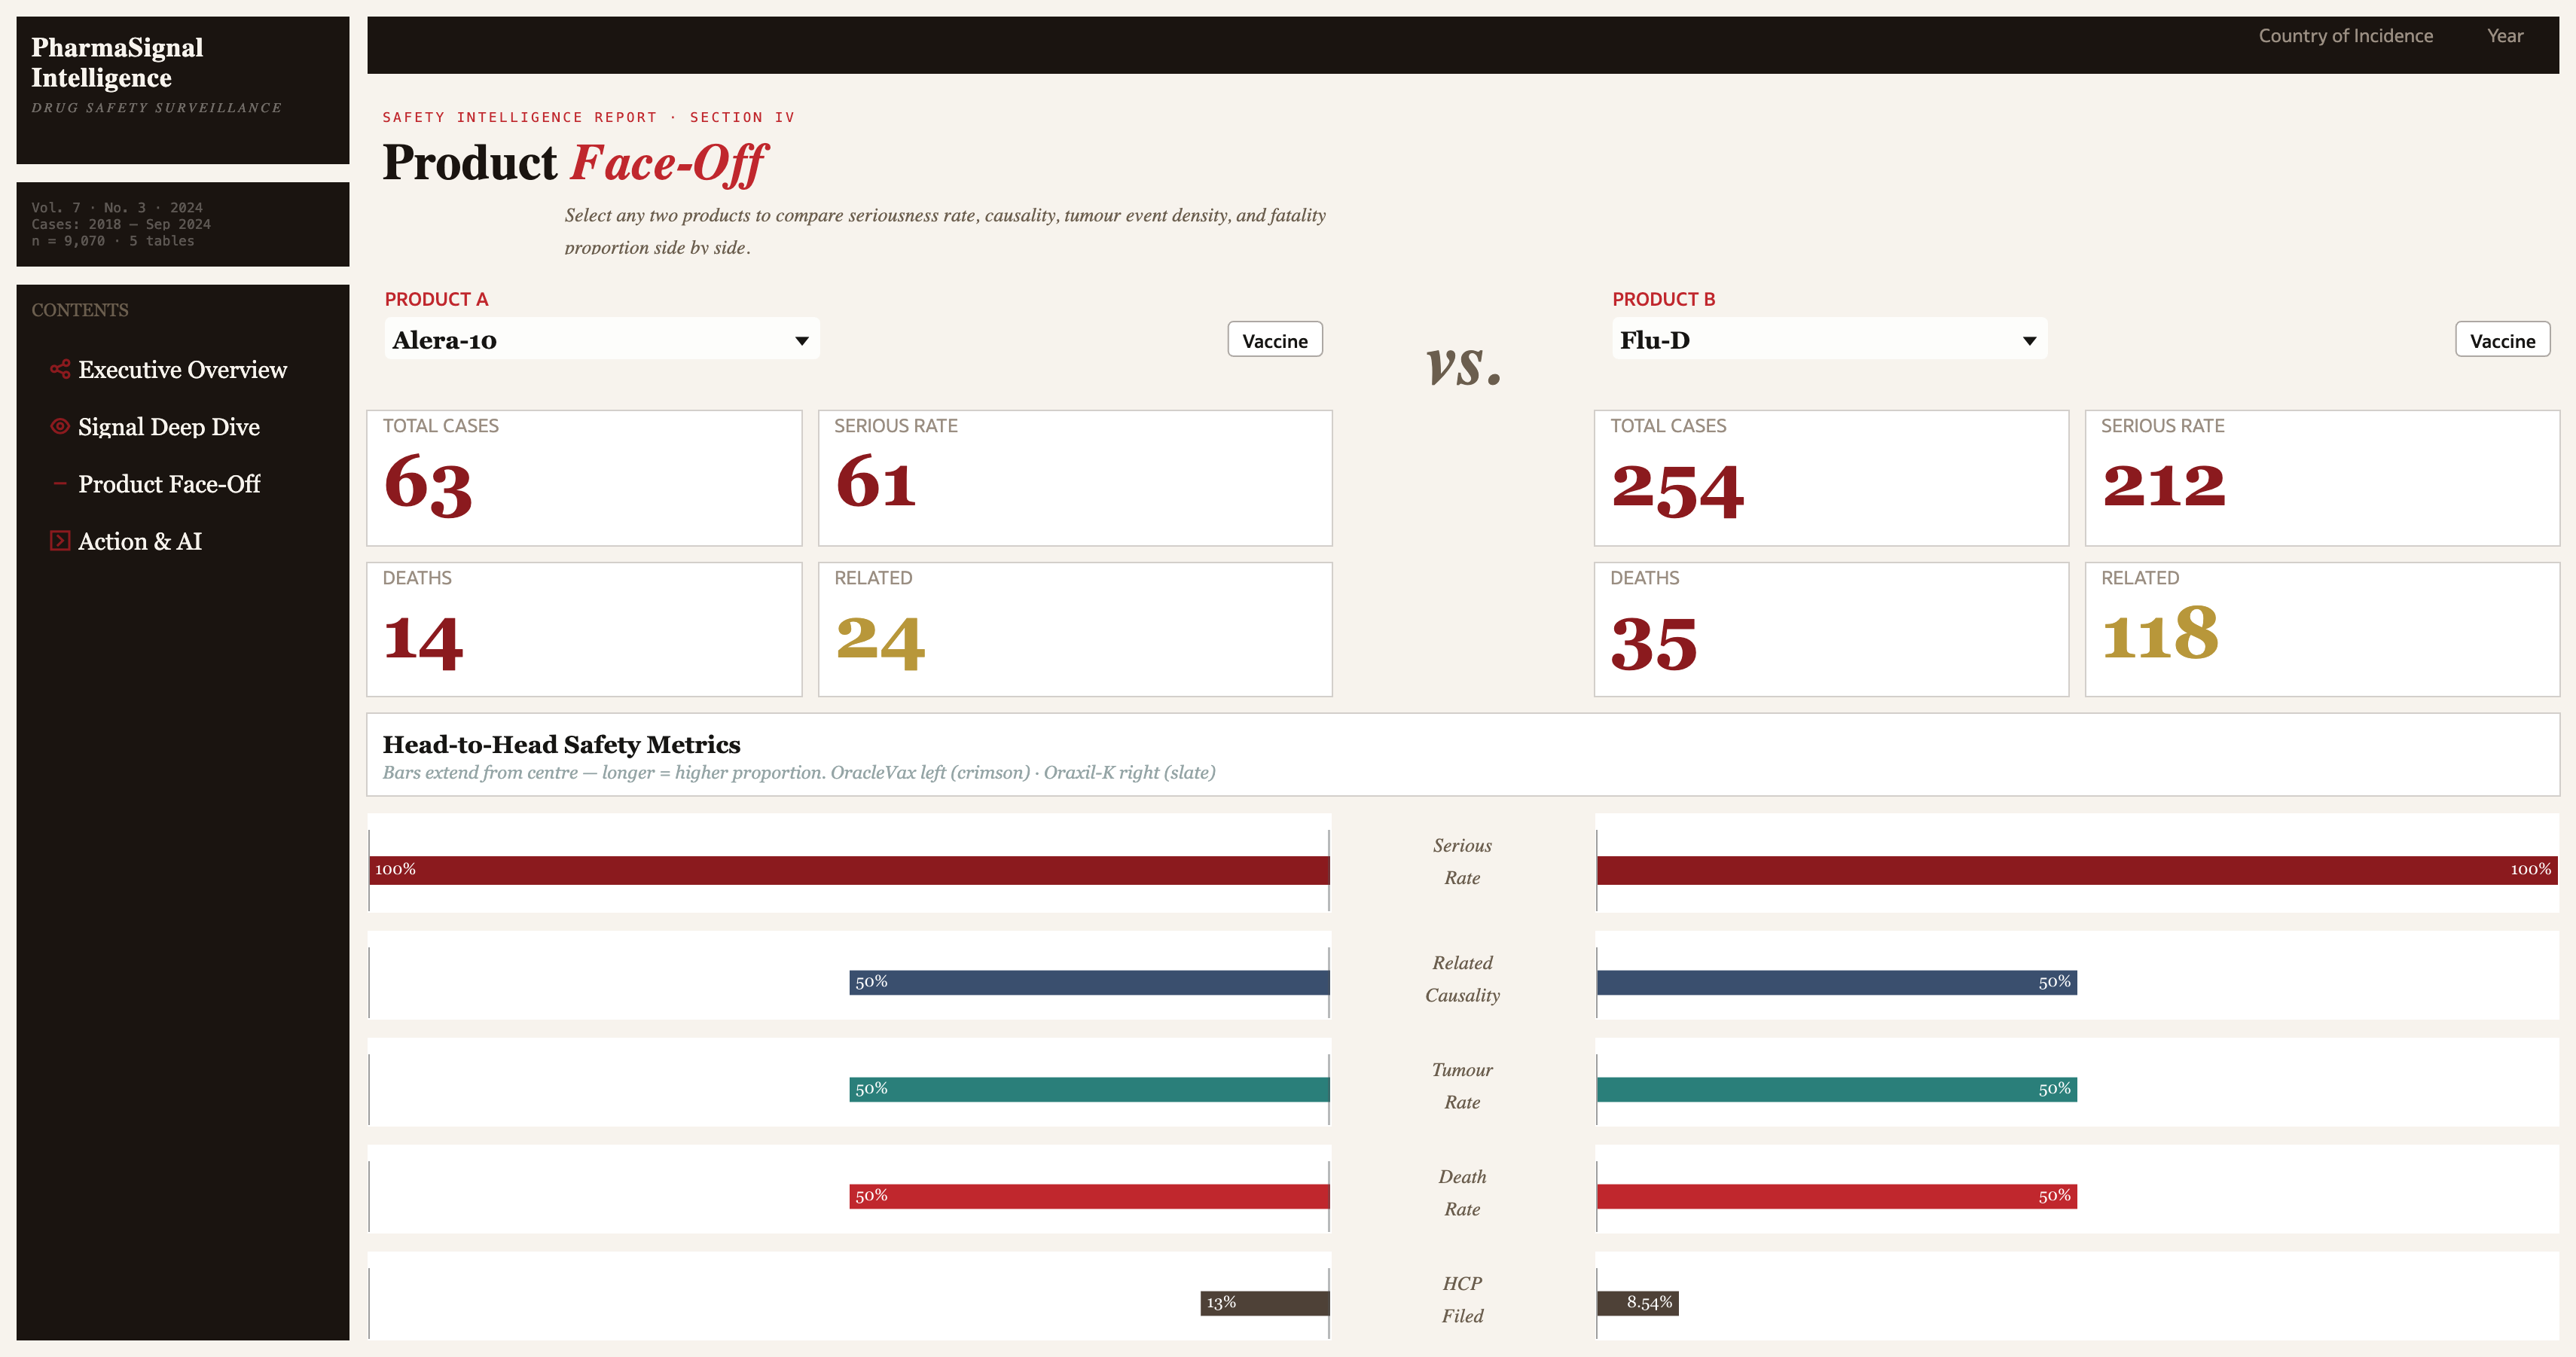
- Product Face-Off — comparative analysis across drugs and vaccines to identify product-specific risk profiles
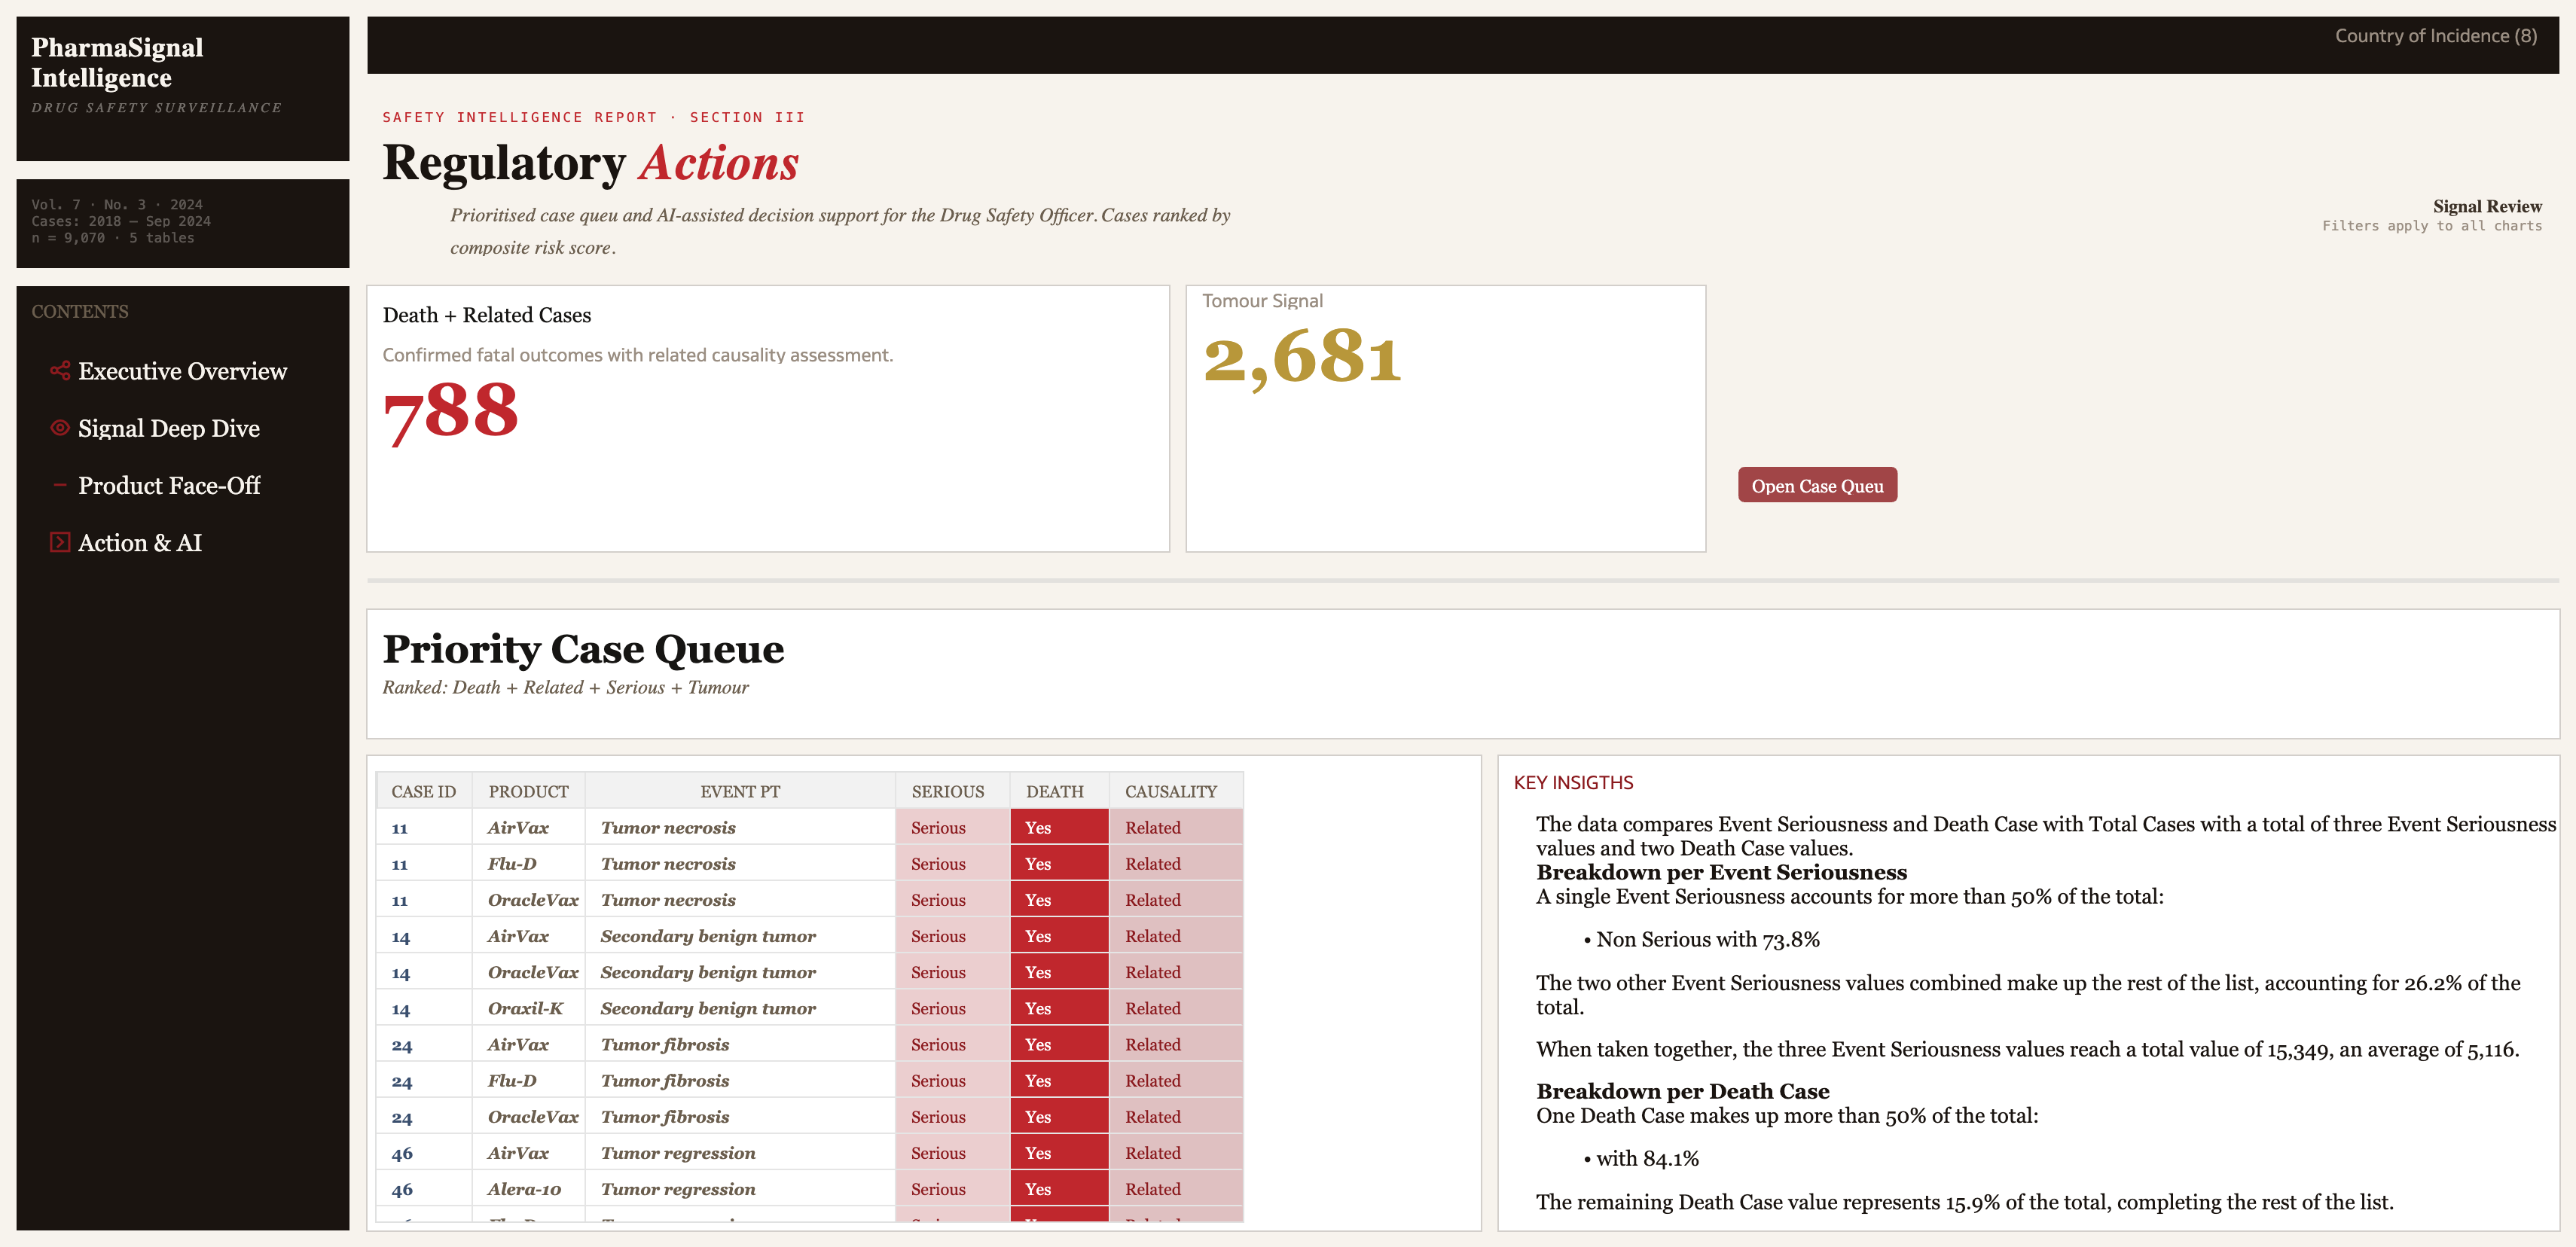
- Action & AI — AI-assisted insights and recommended actions based on the data (pending to incorporate AI Agent here)
The design was intentionally modeled after a trusted medical publication layout to provide a familiar experience for healthcare professionals, elevating trust in the data and improving readability for the intended audience.
5. Did you use any Oracle Analytics AI features?
Yes, I used the AI Assistant to query the data conversationally and gain quick insights. I also used Auto-Insights and Explain to automatically surface key trends in adverse events. Additionally, I began exploring the AI Agent feature to build a guided analytics experience, though time constraints prevented full incorporation into the final submission.