1.Which dataset did you use?
I used a Hospital Management data with the following key attributes.
- Patients - Core demographic, clinical status, severity scores, LOS data
- Medications – Drug Administration, Missed Doses, Schedules
- Labs – Test Orders, Result Status
- Readmissions – Previous Admissions, Reasons, Days Since Discharge
- Procedures – Surgeries, Outcomes, Durations
- Tasks – Pending Clinical Tasks, Priorities, Wait Times
- Staff Duty – Doctor Shifts, Patient Loads, Deterioration Events
2. How did you analyze or prepare the data?
The dataset has been prepared to enable a 360-degree analysis of hospital operations, covering areas such as patient management, doctor workload, laboratory activities, readmissions, procedures, task management, and staff duty efficiency.
The data preparation process incorporates techniques such as Exploratory Data Analysis (EDA), recommendations, aggregations, calculated fields, and derived metrics to support deeper insights and effective decision-making.
3. Who is the intended audience for your visualization?
- Hospital Administrators / C-Suite:
- Clinical Department Heads:
- Quality & Safety Officers:
- Doctors & Supporting Staff
Specific Problems Addressed:
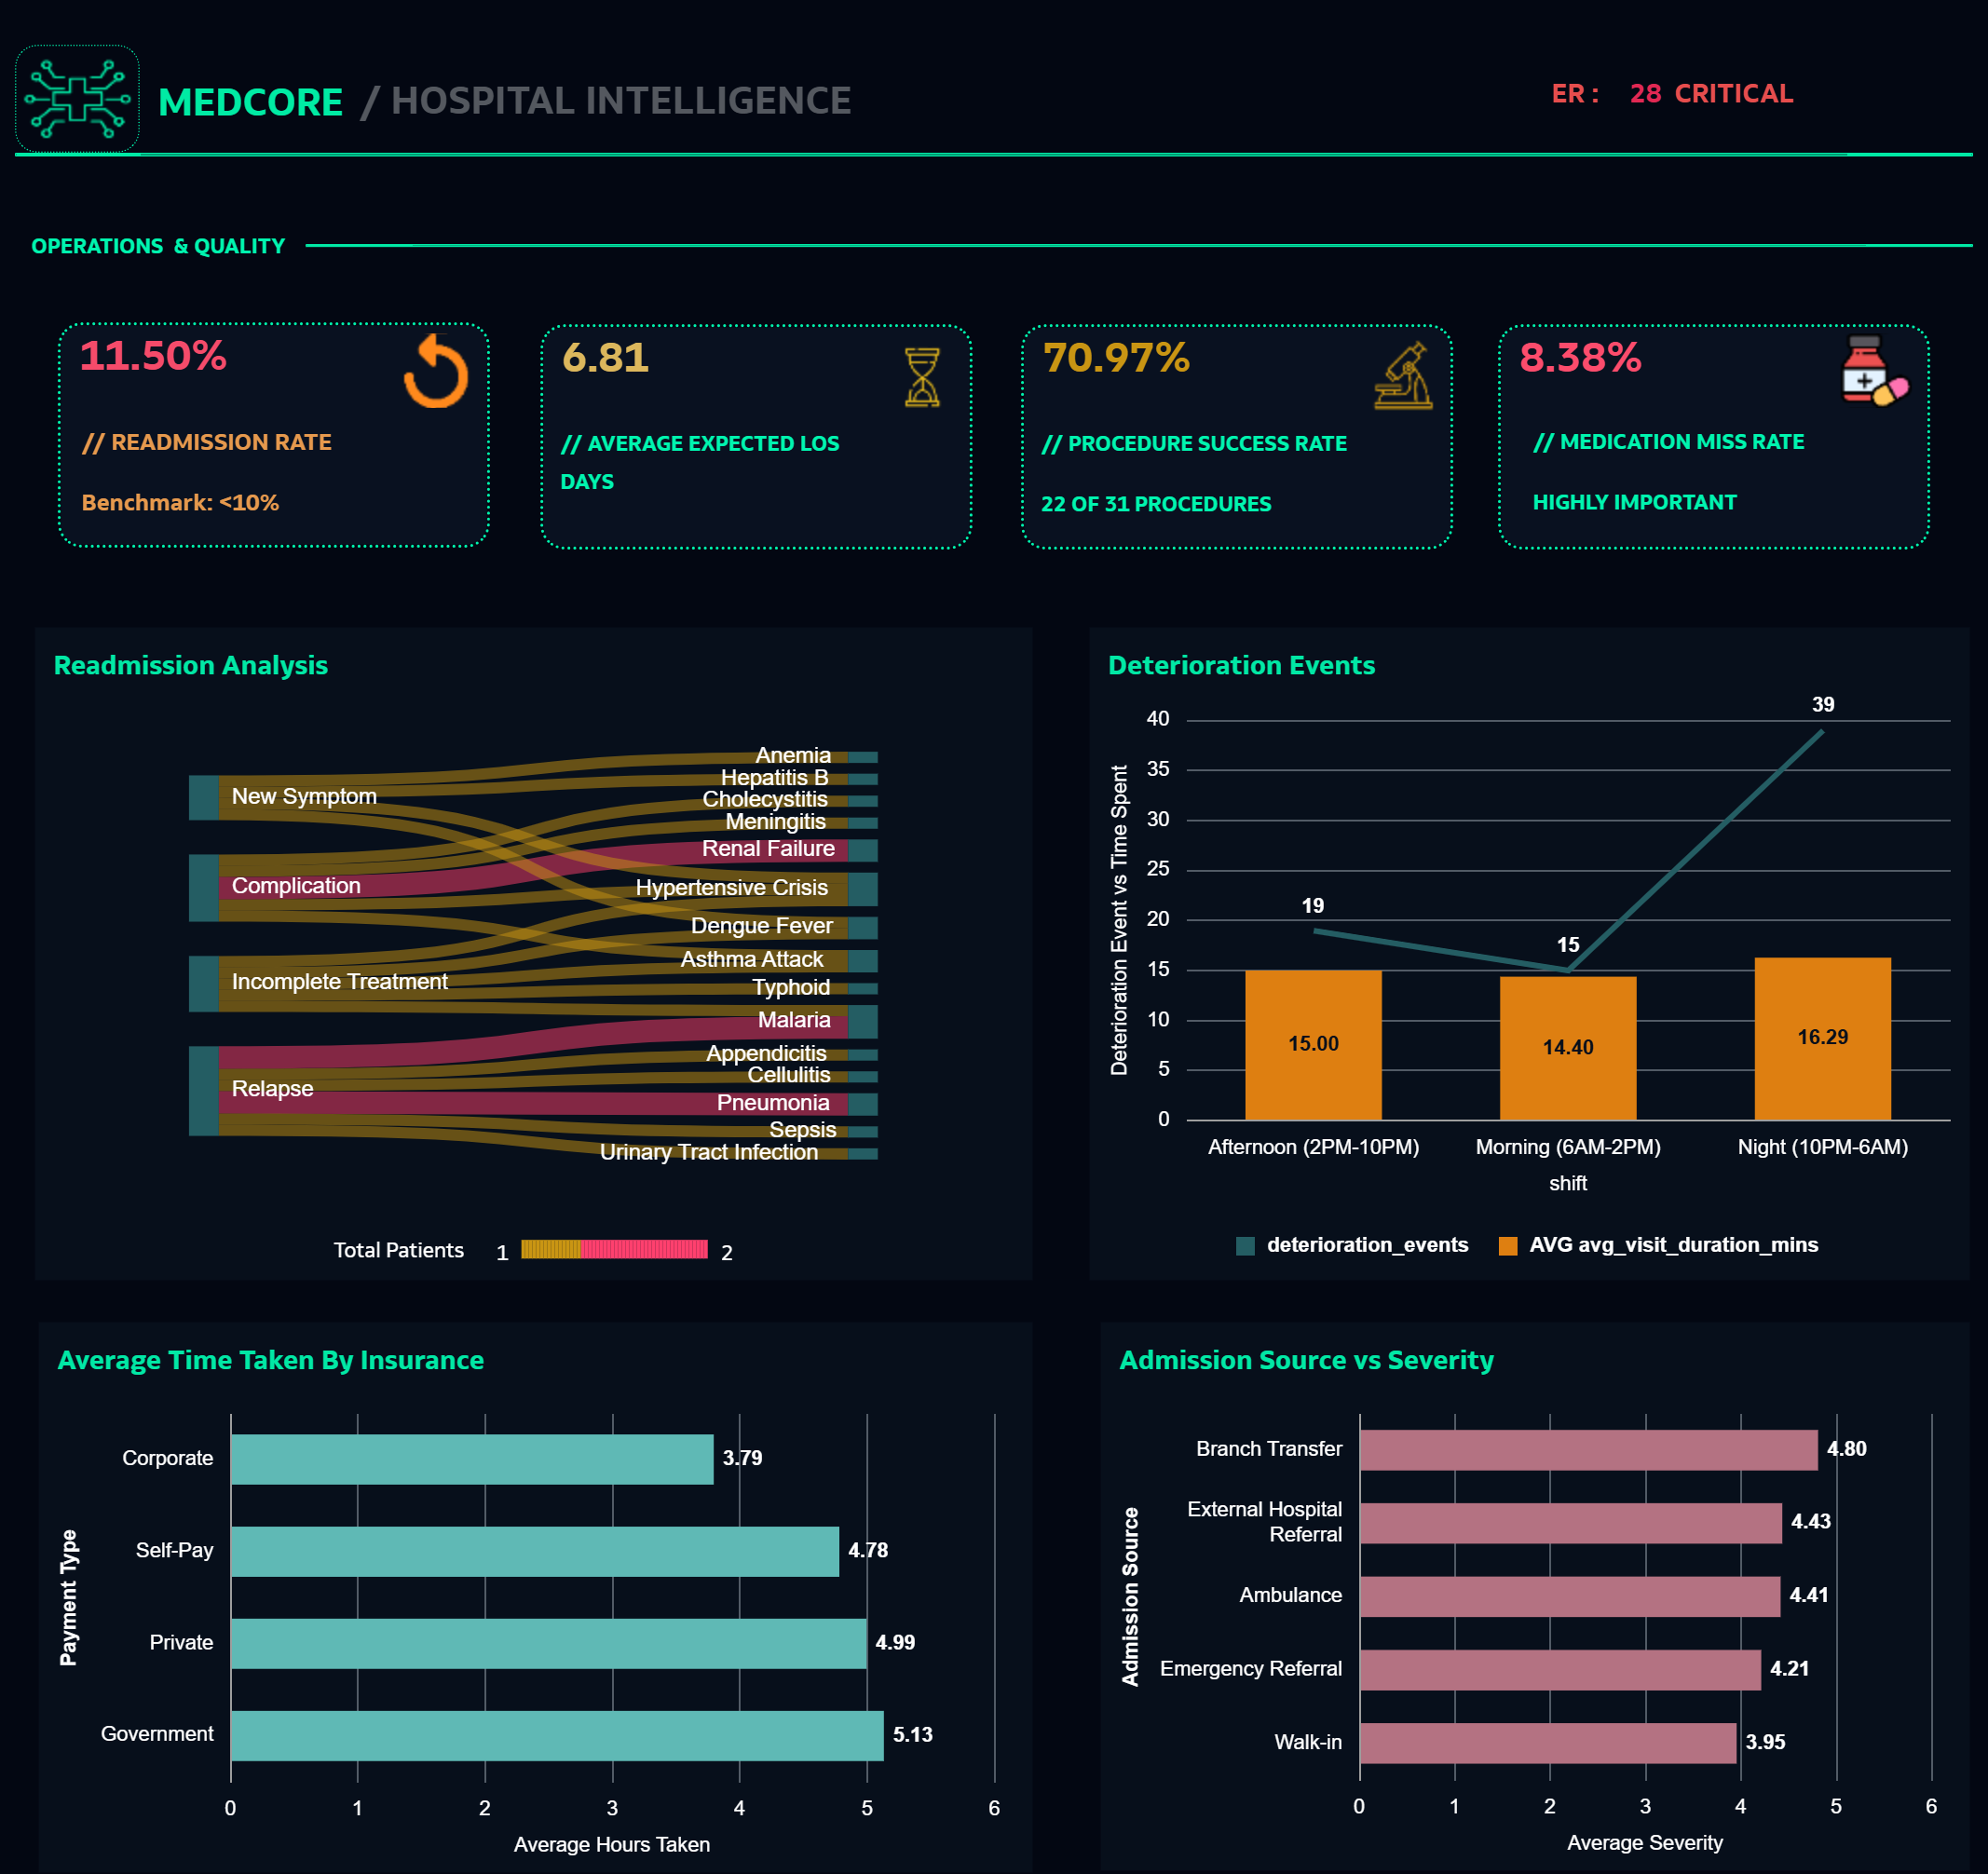
- KPIs at the top (critical patients, readmissions, LOS overruns, medication misses)
- Branch performance comparison
- Quality metrics (procedure success rate, readmission rate)
- Resource allocation insights (doctor workload, ward occupancy)
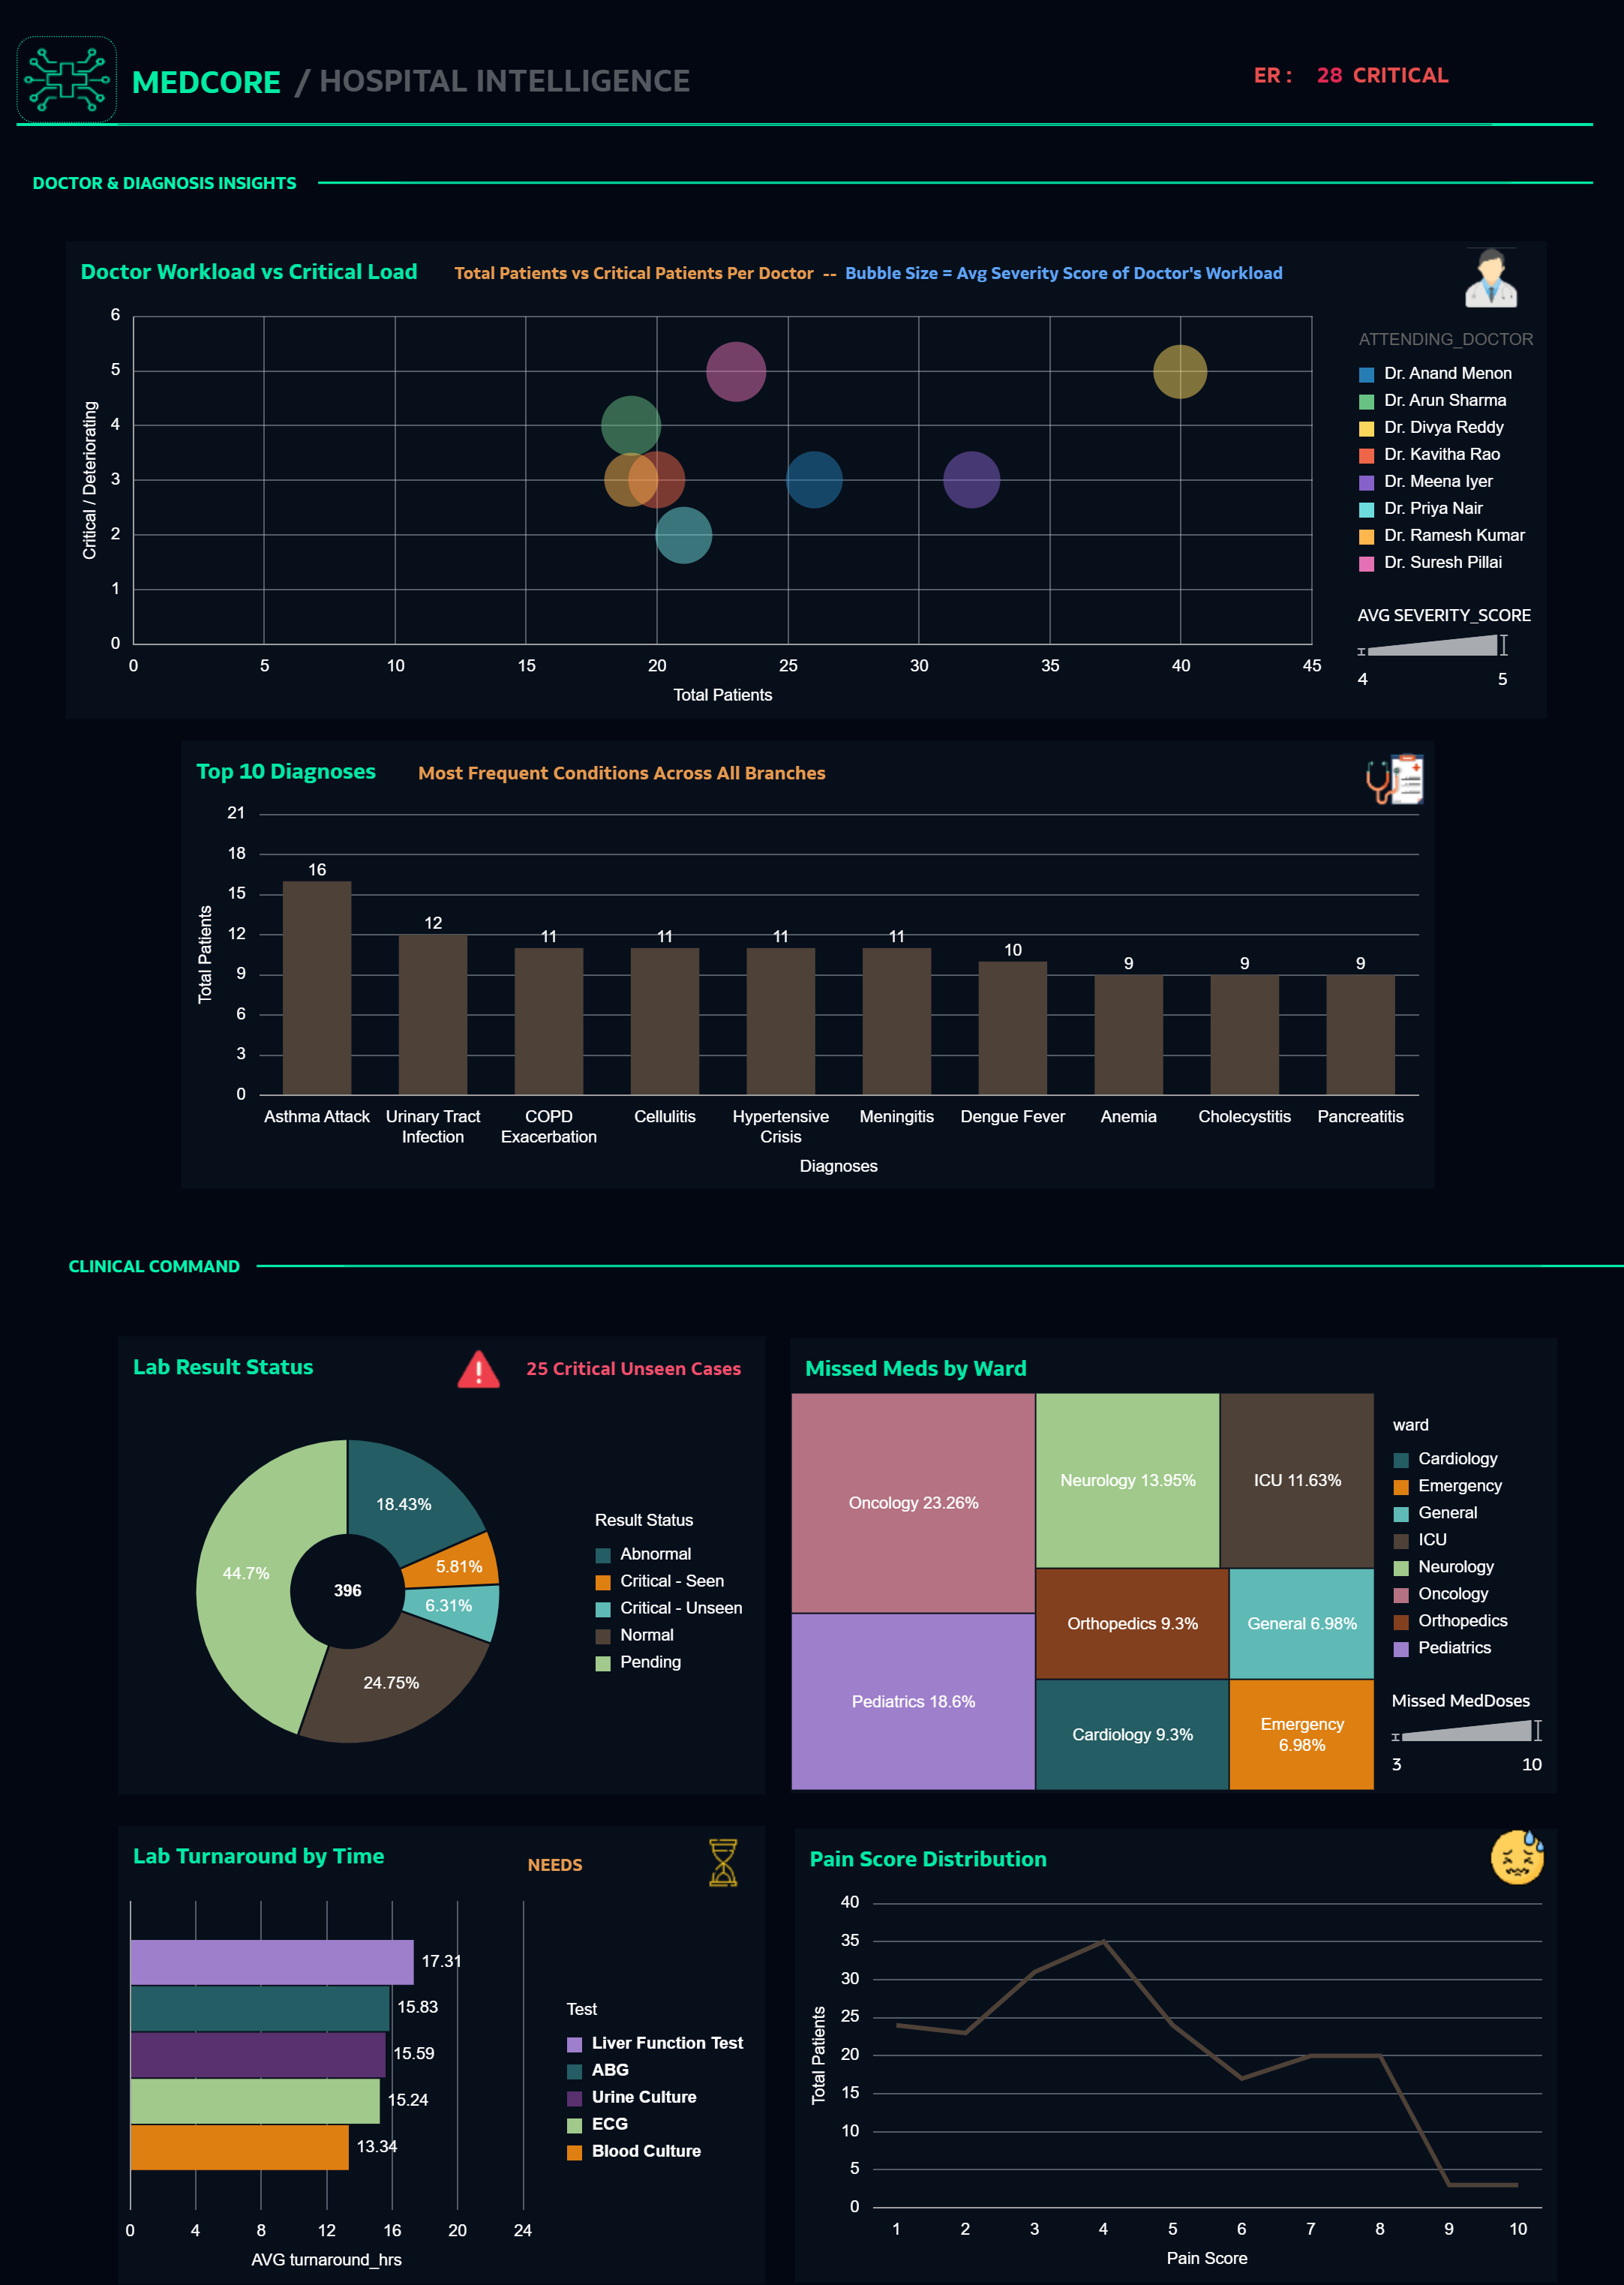
- Doctor workload vs critical patient load (bubble chart)
- Ward-specific severity breakdowns
- Top diagnoses requiring clinical protocol review
- Lab turnaround bottlenecks
- 25 critical unseen labs (immediate action needed)
- 43 missed medication doses (safety concern)
- Deterioration events by shift (staffing analysis)
- Readmission patterns (discharge planning effectiveness)
- Average LOS vs expected (capacity planning)
- Admission source vs severity (triage optimization)
- Insurance type vs wait time (equity monitoring)
- Ward occupancy distribution
5. Did you use any Oracle Analytics AI features when building your visualization (ex. AI Assistant)? If so, please describe how they were used.
The AI Agent feature has been leveraged and deployed alongside the workbook to enhance analytical capabilities.
Agent Name: MediAssist – Doctor’s Clinical Decision Support Assistant
The agent enables quick access to key clinical references, including:
- Symptom-to-condition mapping across 146 disease records
- Suggested diagnostic tests relevant to identified conditions
- Medications associated with specific conditions (for reference only; no dosage guidance provided)
- Information on severity levels, risk factors, and recovery timelines
- Contagion status and age/gender susceptibility patterns
A demonstration of the AI Agent’s functionality has been attached in the form of a video.