Categories
- All Categories
- Oracle Analytics and AI Learning Hub
- 54 Oracle Analytics and AI Sharing Center
- 26 Oracle Analytics and AI Lounge
- 311 Oracle Analytics and AI News
- 57 Oracle Analytics and AI Videos
- 16.4K Oracle Analytics and AI Forums
- 6.7K Oracle Analytics and AI Labs
- Oracle Analytics and AI User Groups
- 117 Oracle Analytics and AI Trainings
- 24 Oracle Analytics and AI Challenge
- Find Partners
- For Partners
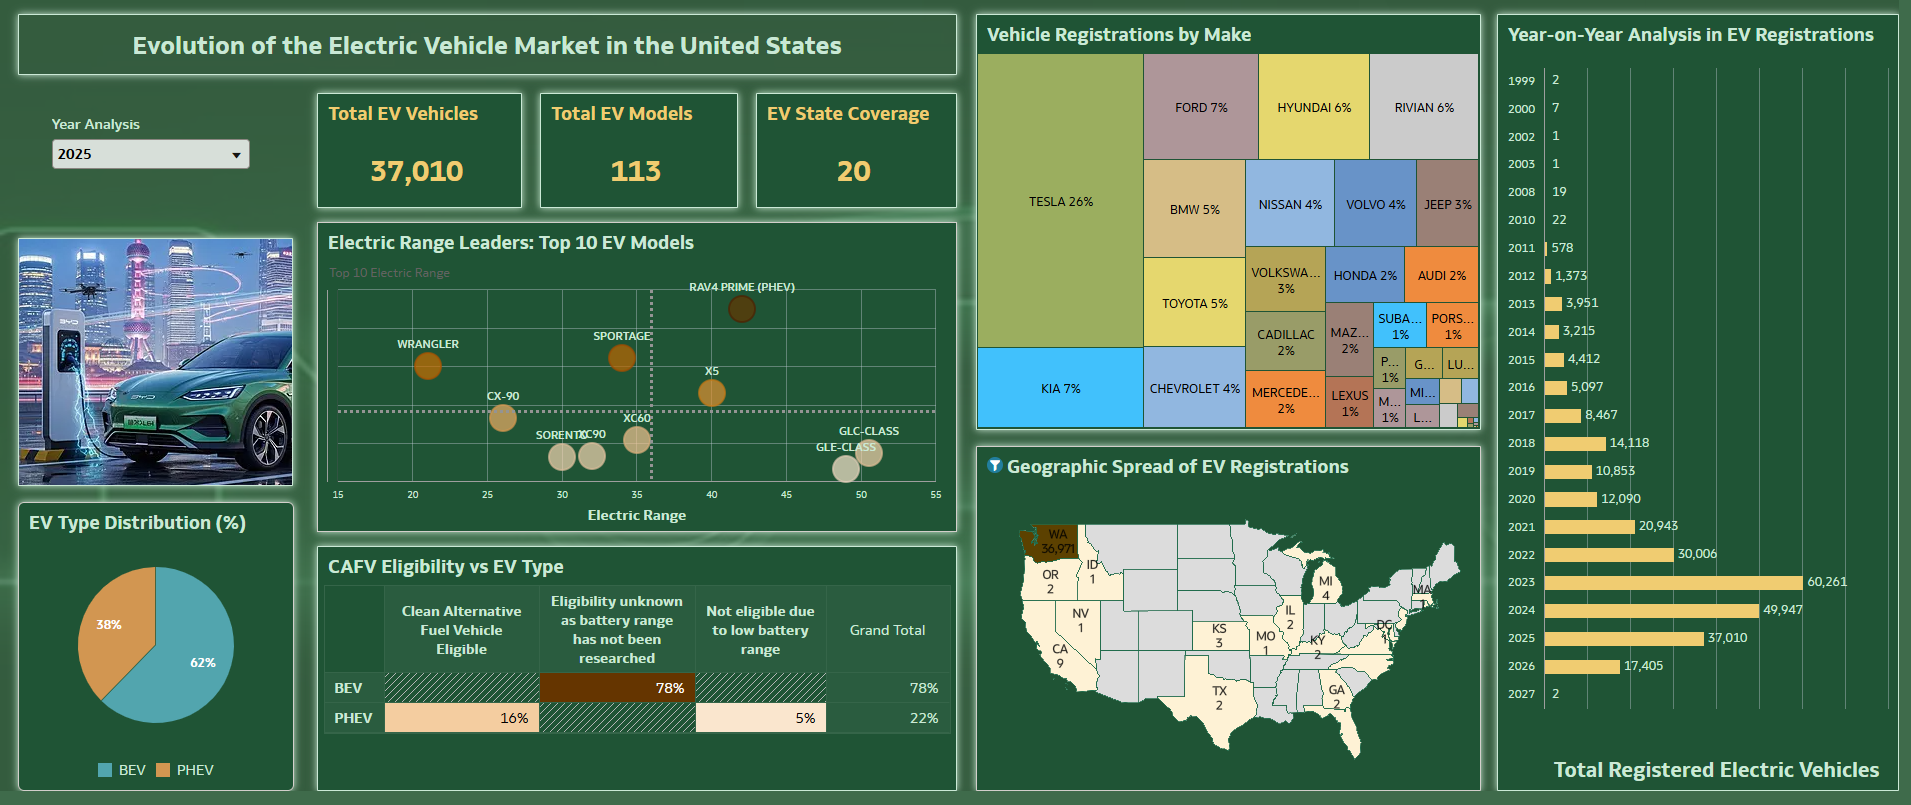
Evolution of EV Market in United States

1.Which dataset did you use?
Evolution of the EV Vehicle in United States
2. How did you analyze or prepare the data?
Downloaded from Data.Gov, and make use of Insights, and the Best Visualizations and the reports used in Market
3. Who is the intended audience for your visualization?
Analysts, policymakers, and automotive stakeholders tracking EV trends and market growth. Also for the public to understand EV trends and market growth.
4.What is your visualization about, and what question or problem does it address?
My Data Visualization helps businesses to make smarter decisions using clear insights on EV demand, trends, and market growth.
5. Did you use any Oracle Analytics AI features when building your visualization (ex. AI Assistant)? If so, please describe how they were used
Yes make use of AI Insights, clusters suggested by AI and also used forecast based on ML
Comments
-
Has a lot of interesting facts presented in a clean format to visualize.
1 -
Great visual analysis -clear, engaging, and easy to understand.
1 -
Clear, engaging, and easy-to-understand visual analysis.
1 -
Good use of mixed chart types, consistent color scheme. Could have added some narratives, etc
1 -
Ita really clear presentation how 2025 EV market in US. Nice used different visualizations to showcase fact of EV market.
1


