Categories
- All Categories
- Oracle Analytics Learning Hub
- 33 Sharing Center
- 22 Oracle Analytics Lounge
- 258 Oracle Analytics News
- 45 Oracle Analytics Videos
- 16.1K Oracle Analytics Forums
- 6.3K Oracle Analytics Idea Labs
- Oracle Analytics User Groups
- 98 Oracle Analytics Trainings
- 16 Oracle Analytics and AI Challenge
- Find Partners
- For Partners
Chart/Graphs do not allow customizing decimal places
Description
Develop functionality to edit decimal places on charts and graphs, instead of only just columns
Use Case and Business Need
Hello!
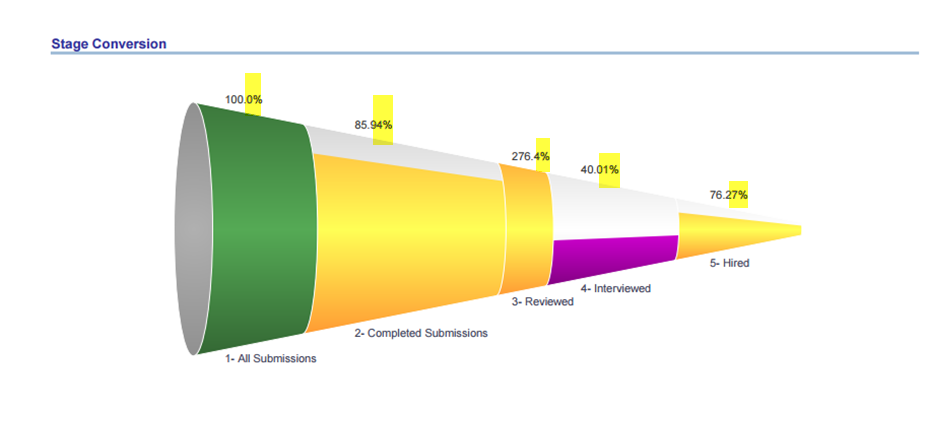
Currently when you build reports, you can edit the decimal settings via column formatting. In one instance, we set it to remove decimal points. If you change your view of your report to include charts or graphs, the decimal points will show up by default. This is hardcoded. We would like Oracle to develop functionality to allow editing this function for charts and graphs, in addition to tables.
Original Idea Number: b3a033ab21

Comments
-
When you add or remove decimal places in column formatting, the change is synchronized in Table and Graph views too.
0 -
Hi Ling, is that true? According to the SR I submitted I was told " After troubleshooting your OBI report and discussing with our OBI subject matter expert (SME), it appears that the chart/graph tools do not currently allow customizing the decimal places setting even if the Column Formatting itself is set to 0 decimal places. Unfortunately, you will need to submit an Enhancement Request through our Customer Connect Portal and our Development team will review it for inclusion in a future Taleo release. "
0