Hello,
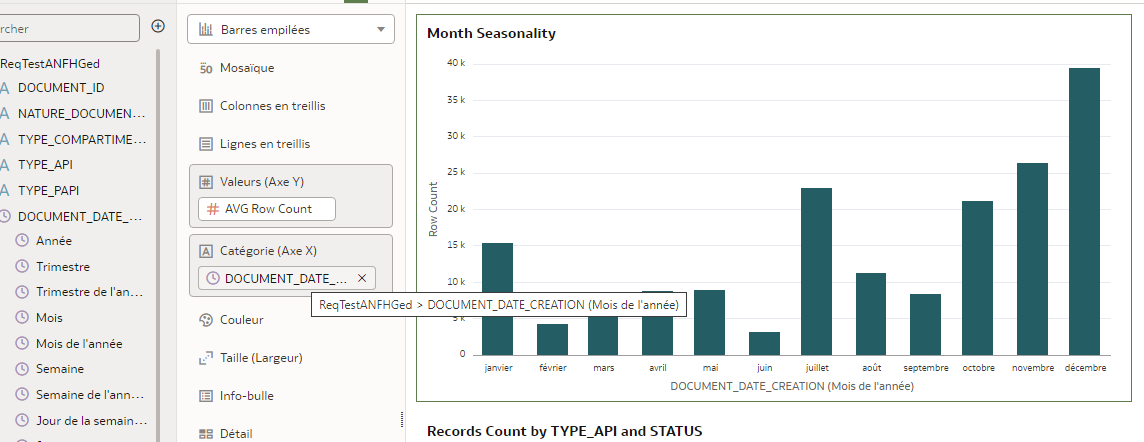
When I working with Datetime field in a workbook (source Dataset) OAC also show me the derived subfields (Year, Quarter, Month, Day..) and I have the possibility to make a bar graph like bellow very easily (in this case ordered by Year Month or 'Mois de l'année' in french) .
If a want to display the quarters I can choose 'Show by' select the appropiate value.
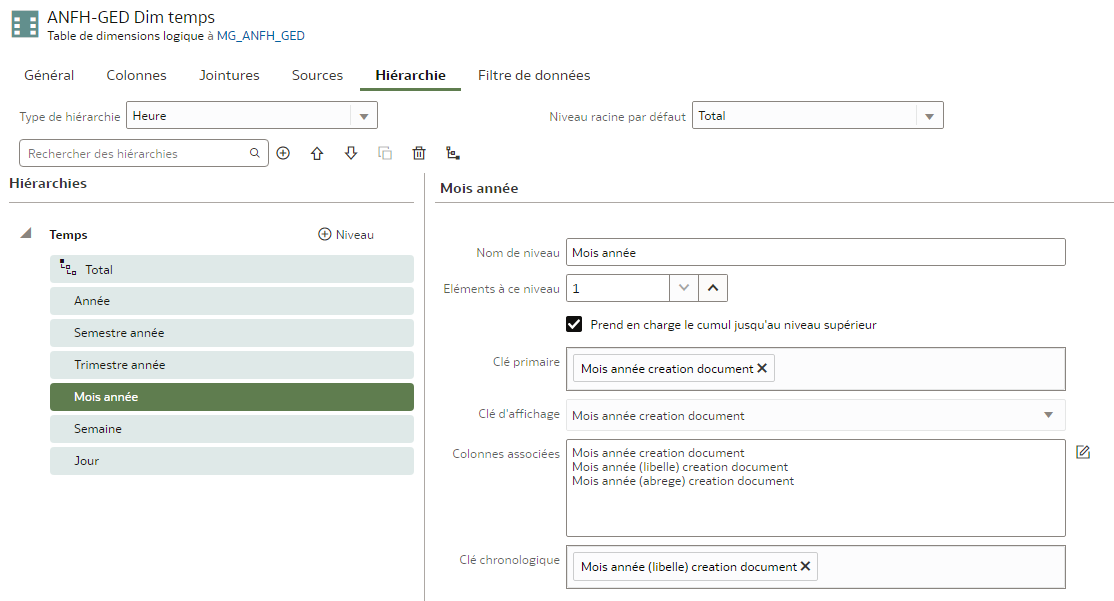
When I have a Semantic Model behind (and we work mainly with semantic models) I don't have this possibility to drill and chose the Year Month. I had to add 2 calculated fields to extract the desired fields but with a little drawback:
The calculated fields are:
- The Year Month ( 'Mois (libelle) creation document' in french) = MONTHNAME("Date creation document")
- The Month Index ('Mois creation document' in french ) = MONTH("Date creation document")
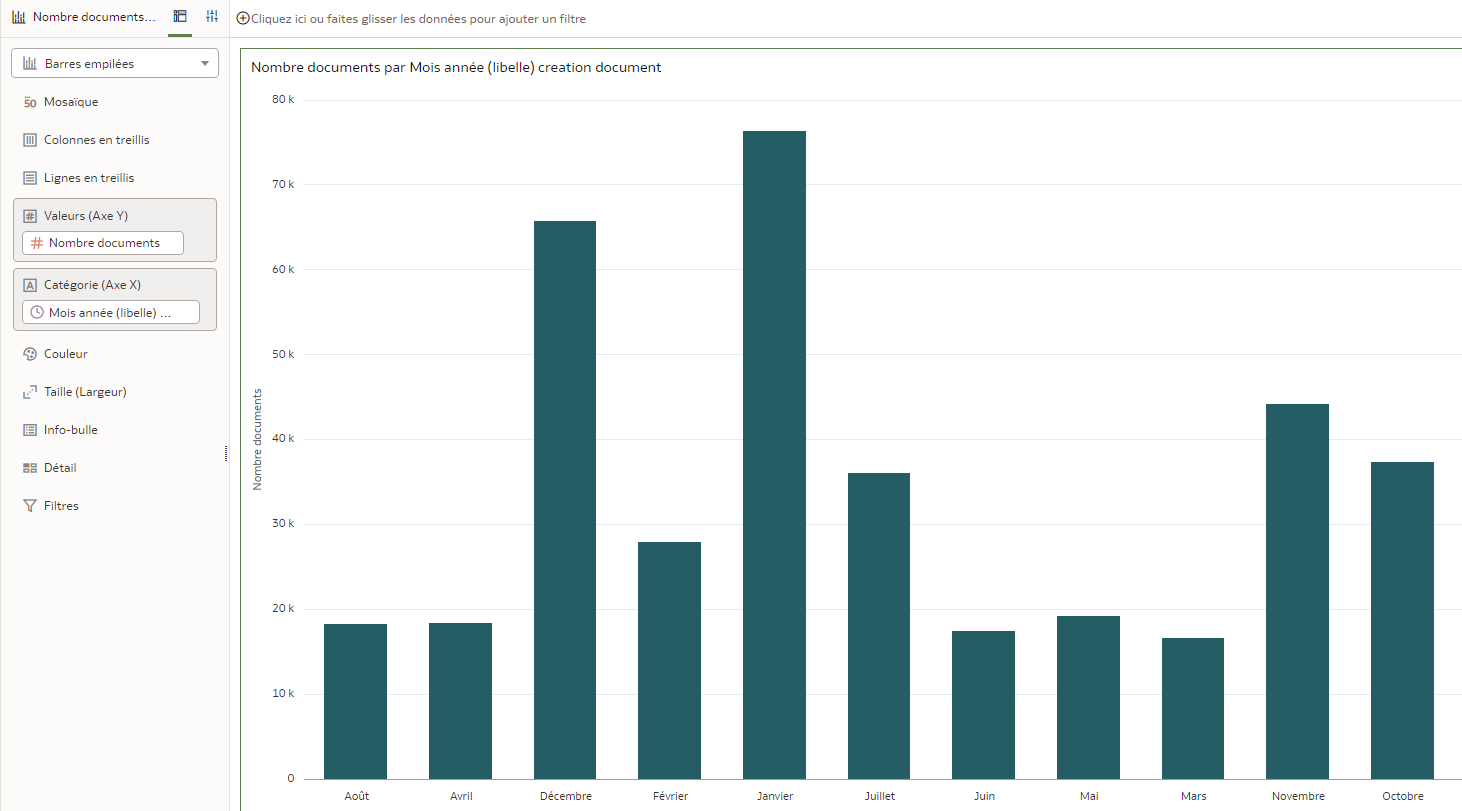
Then I added the both columns in Category (X axis) and I filtered on Month Index accending to obtain this graphic below.
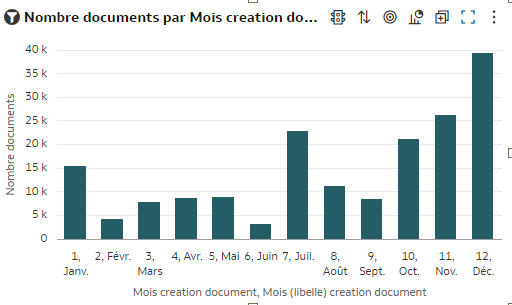
The drawback is: I want to display only 'Janv', 'Fevr'.. on X axis (without month index) add sort by month index without displaying '1, Janv', '2, Fevr' etc .
If I don't add the second column (Month Index) I obtain a bar chart like this (order alphabetically by month). I think it's not very funny.
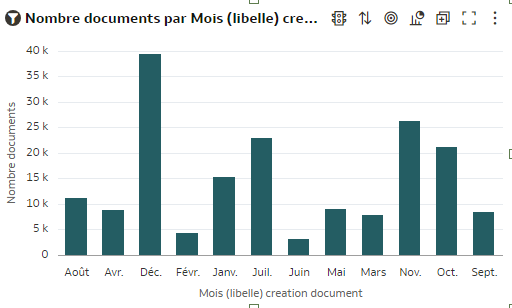
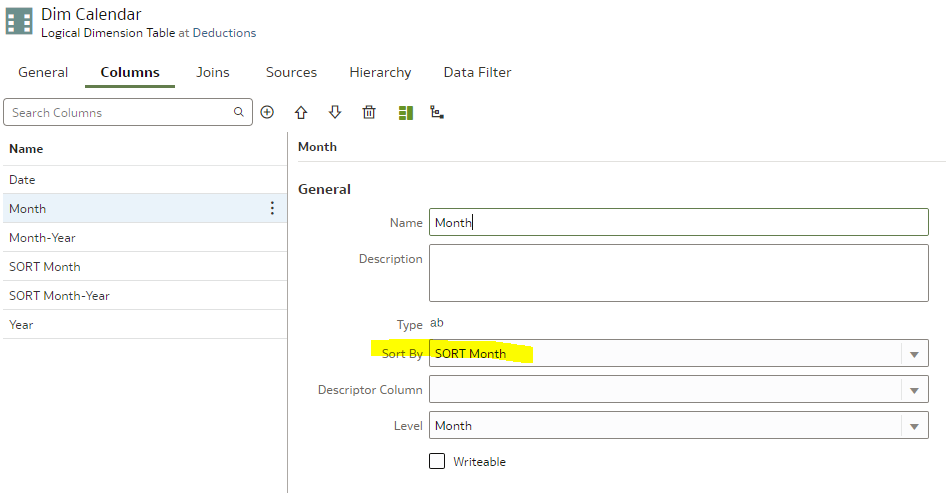
Sometimes we need to to sort by a column but not displaing it (not possible for moment or I don't know how )
Did you intent to add the same behavior for the workbooks builded on semantic models (like the Dataset version) ?
Thanks,
Daniel