Categories
- All Categories
- Oracle Analytics and AI Learning Hub
- 53 Oracle Analytics and AI Sharing Center
- 25 Oracle Analytics and AI Lounge
- 306 Oracle Analytics and AI News
- 57 Oracle Analytics and AI Videos
- 16.4K Oracle Analytics and AI Forums
- 6.6K Oracle Analytics and AI Labs
- Oracle Analytics and AI User Groups
- 118 Oracle Analytics and AI Trainings
- 22 Oracle Analytics and AI Challenge
- Find Partners
- For Partners
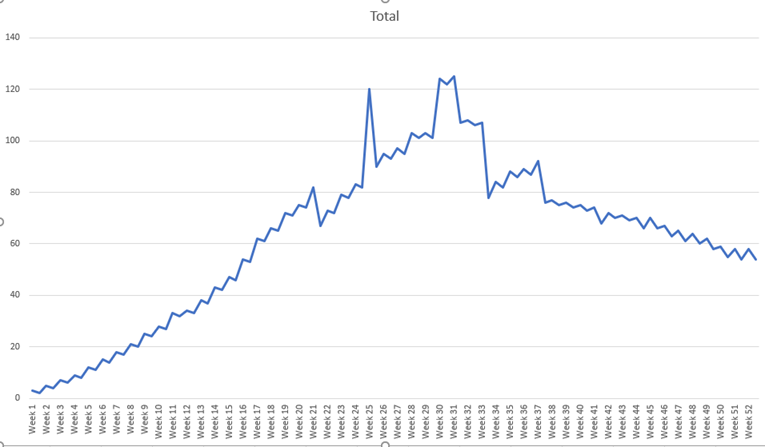
Creating Trend Line charts using BIP Offline Editor for Word

Have been grappling with how to generate time based trend charts to track status trends.
For example, the source data is in this general format:
- Record 1 - Opened 10/01/24 - Closed 23/01/24
- Record 2- Opened 13/01/24 - Closed 31/01/24
- Record 3 - Opened 02/02/24 - Closed 14/02/24
- ….etc
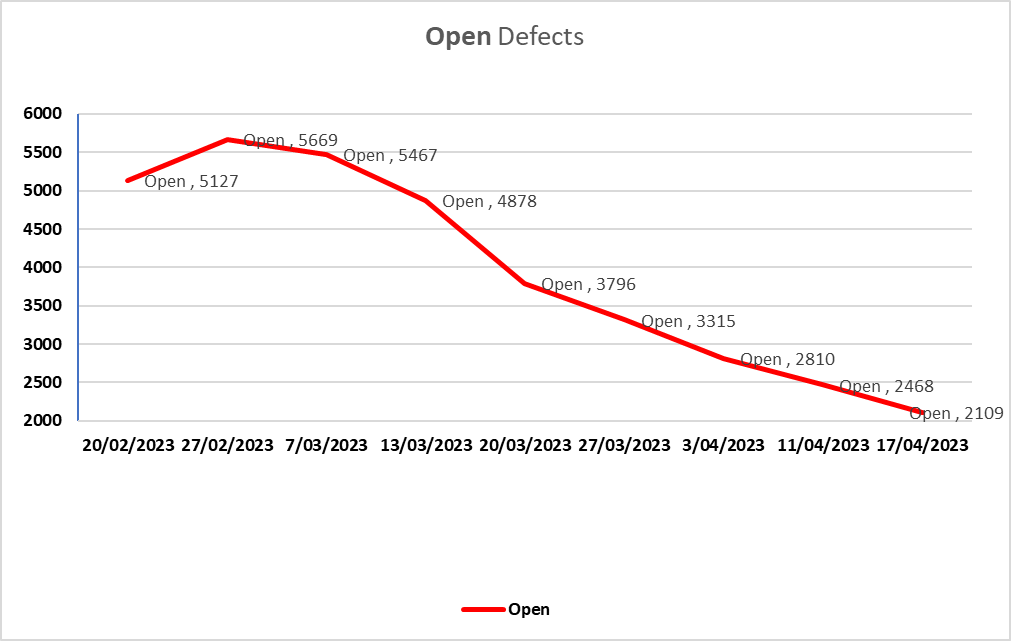
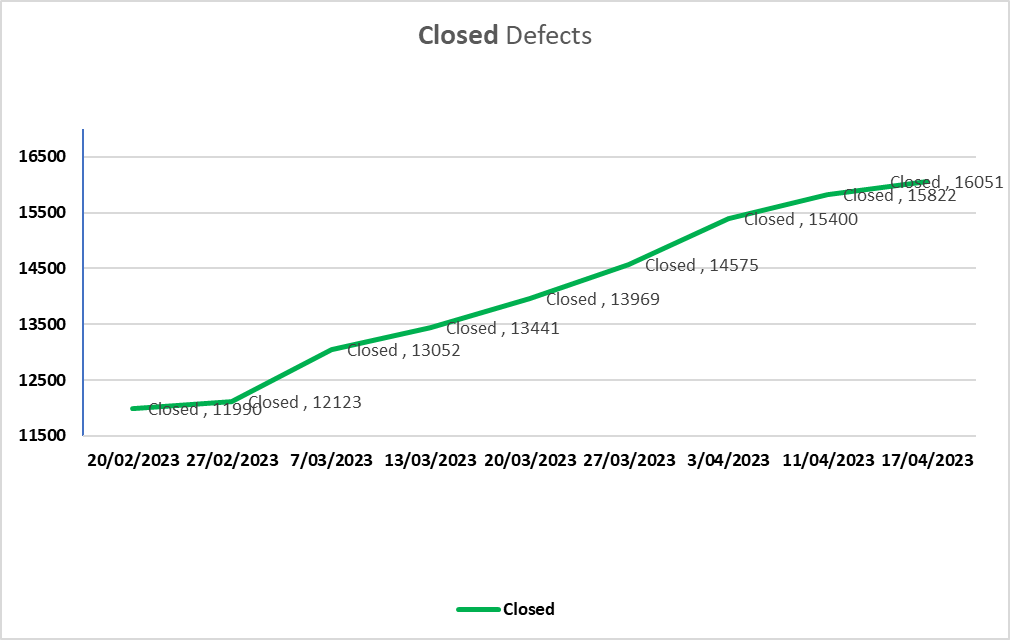
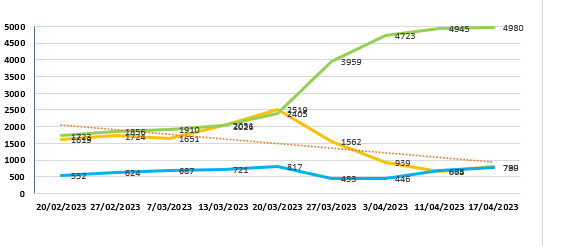
What I am looking to achieve is a running total on a period basis of Open records vs Closed records at any point in time. eg Week 3 how many records are Open and how many records are Closed. Either a single trend line or 2 overlapping trend lines
Some examples attached:
Answers
-
You need a proper "time dimension", a source of data with all the days, and then join it to your current data to generate the status of each record at any point in time.
There isn't a thing doing time based trends out of a line with start-end or open-close, you need to transform your data into a row per each record and time granularity you look for with a single status.
0
