Hello Team,
we would like to modify a ring graph on Oracle Bi Publisher RTF.
In the following image there is the current graph.
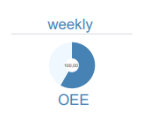
We would like to obtain something like this:
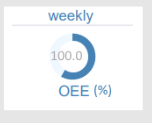
reducing the thickness of the graph and increasing the font for 100 in the center, also adding % to the label. How can I modify the xml to get a similar result? I can't find anything about it
The XML code:
<Graph seriesEffect="SE_NONE" graphType= "RING_MULTI"><LegendArea visible="false"/>
<Title text="weekly" visible="true" horizontalAlignment="CENTER">
<GraphFont size="36" bold="false" italic="false" underline="false" fontColor="#4682B4"/>
</Title>
<SeriesItems><Series id="0" color="#4682B4"/><Series id="1" color="#F0F8FF"/></SeriesItems>
<PieLabel>
<GraphFont size="36" bold="false" italic="false" underline="false" fontColor="#4682B4"/>
</PieLabel>
<SliceLabel visible="false">
</SliceLabel><LocalGridData colCount="{count(xdoxslt:group(.//DATASET_OEE, 'TAG_OEE'))}" rowCount="2">
<RowLabels><Label>OEE</Label>
<Label>_100_OEE</Label></RowLabels>
<ColLabels><xsl:for-each-group select=".//DATASET_OEE" group-by="TAG_OEE"><Label><xsl:value-of select="current-group()/TAG_OEE"/></Label></xsl:for-each-group></ColLabels>
<DataValues><RowData><xsl:for-each-group select=".//DATASET_OEE" group-by="TAG_OEE"><Cell><xsl:value-of select="sum(current-group()/OEE[.!='']) div count(current-group()/OEE[.!=''])"/></Cell></xsl:for-each-group></RowData><RowData><xsl:for-each-group select=".//DATASET_OEE" group-by="TAG_OEE"><Cell><xsl:value-of select="sum(current-group()/_100_OEE[.!='']) div count(current-group()/_100_OEE[.!=''])"/></Cell></xsl:for-each-group></RowData></DataValues>
</LocalGridData>
</Graph>
Thanks in advance

