Categories
- All Categories
- Oracle Analytics and AI Learning Hub
- 43 Oracle Analytics and AI Sharing Center
- 19 Oracle Analytics and AI Lounge
- 281 Oracle Analytics and AI News
- 57 Oracle Analytics and AI Videos
- 16.2K Oracle Analytics and AI Forums
- 6.4K Oracle Analytics and AI Labs
- Oracle Analytics and AI User Groups
- 105 Oracle Analytics and AI Trainings
- 20 Oracle Analytics and AI Challenge
- Find Partners
- For Partners
Central Texas Severe Weather Outlook

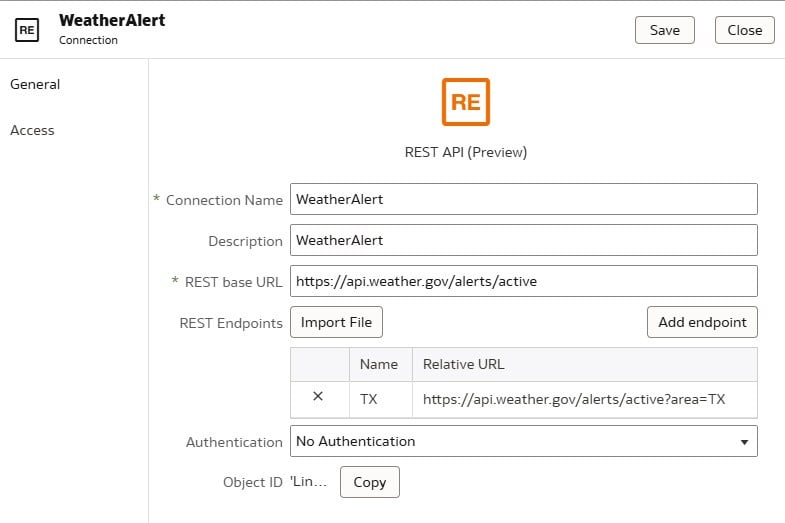
This data visualization pulls weather information from multiple API's that are transformed and caategorized into Severe Weather conditional formatting. Active Fires are also pulled in and geometric distance calculations comparing fire Lon and Lat vs transmission line structure Lon and Lat are used to alert local agencies of impending line outages or asset emergency. A venn diagram is used to distinguish local counties that have one or multiple occurences of severe weather. A looping .gif file is used to display current radar conditions. 🔆
Comments
-
Welcome to the community. Really cool one. Thank you for sharing!
2 -
Awesome range of charts and analysis @User_P36H1 ! So excited to show this viz to the Data Visualization Challenge Judges!
2 -
I love the colors @User_P36H1! With severe weather being one of the highest risks to organizations this DV project is very timely and useful.
2 -
Hi @User_P36H1 Great to see some cool map layers as well as spatial calcs there ! and such a nice way to use the latest venn diagram plugin too ! Really nice job !
1 -
Beautiful viz and awesome presentation.
Thanks for sharing @User_P36H1
0 -
@User_P36H1 Can you please help with the kind of visualization that that you have used for 'Cities and Population Affected By Severe Weather' . How to build such Viz?
0 -
hi, @User_P36H1
in order to create a weather API to pull temperatures, windspeed, etc. use a REST API connection, this will give you a dataset to use for the Funnel chart extension from Oracle OAC plugins. I joined that dataset to each County population to indicate County's at greater risk in the Funnel. thanks !
1 -
Really cool! Thank you for sharing
0


