I am trying to create a dashboard where I can use a filter to hide/show certain visuals, I have found this video which explains how to set up the parameters however I am not able to put visualisations on top of each other like the video shows at 2:20.
Is there a setting I need to enable to be able to do this?
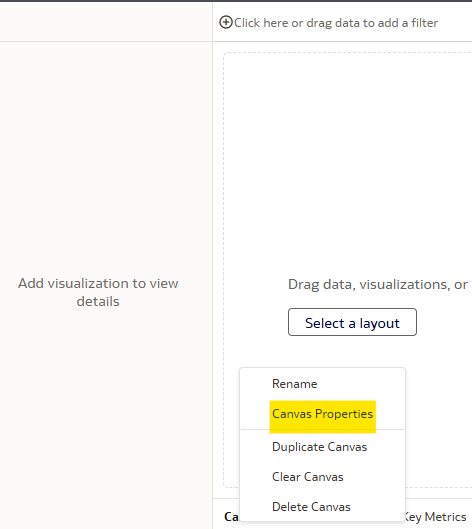
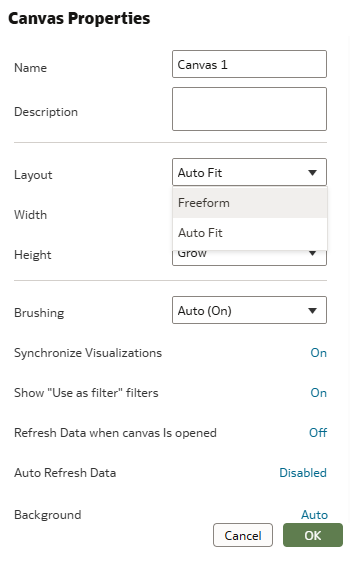
Welcome to the community, @User_GUABF ! You are referring to the Freeform Layout functionality. Canvases default to Auto Fit Layout, but you should have the capability to do change it. To do so:
Here's some documentation about the features within this area:
Very helpful information.
Thanks for sharing @Jamie Anderson-Oracle.
Does Oracle Analytics Server 2026 include AI features such as a built-in chatbot or AI Assistant? If not, are there any plans or indications that these AI capabilities will be introduced in a future OAS release?
Here is my calculation CAST(COUNT(SAAR_ID) AS VARCHAR(50)) || ' SAARs pending as of: ' || CAST(CURRENT_TIMESTAMP(5) AS VARCHAR(50))
In OAC when I am creating a dataset, How can I pass a Filter from the "Dashboard filters to the SQL? I attached a image like it was don in BIP Publisher
How can you put a total number of records in your oracle OAC table footer
we have two seperate environments in air gap… 1- oas 2024 2- oas 2026 developers in both env, required extensions like push button, racing bar, guage…. where to download.