The Formula 1 - Grand Prix Championship dashboard created by ClearPeaks shows data from different races over the years at different levels of detail. This allows the user to get the overview of a specific race at a glance (winner, fastest laps, points won, etc.) as well as delving into more detailed data as position evolution or race telemetries.

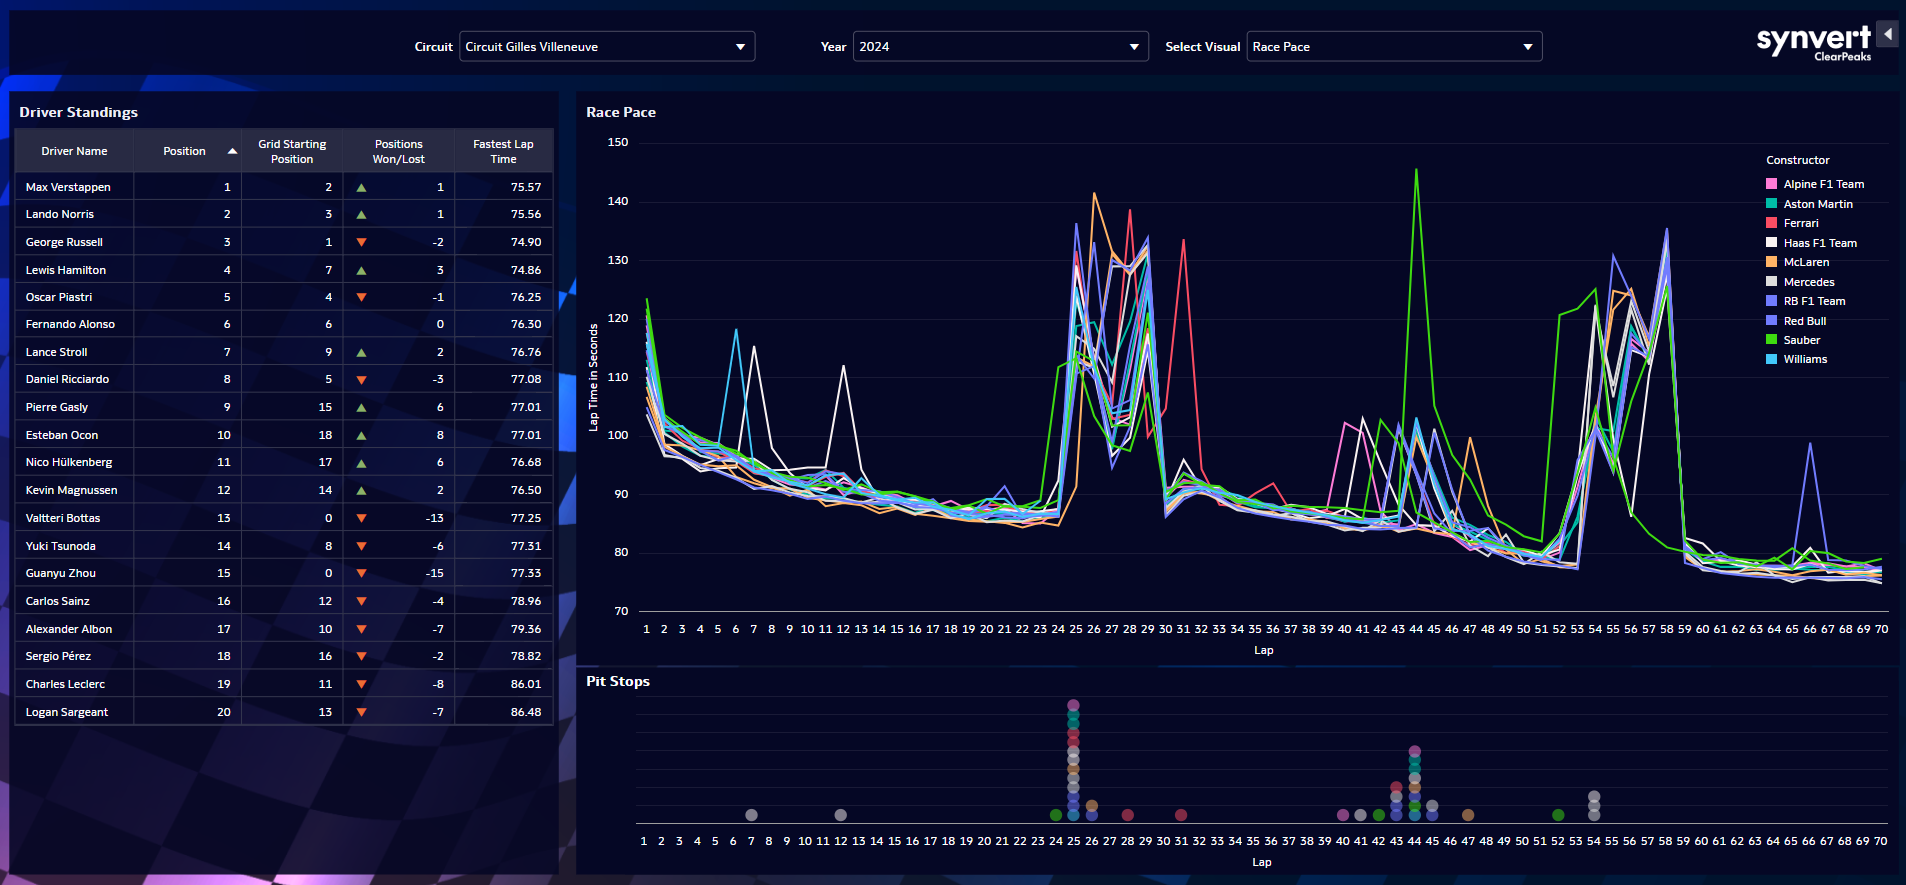
The visualization is easily understandable to any kind of user but may be especially useful for F1 teams aiming to create new strategies based on the data from past races.
Public data has been used and treated to obtain all the needed information and create the dataset used in this dashboard.
The dashboard presents an option to select the visualizations displayed, allowing the user to access to all levels of detail in the same page. Style and presentation have also been optimized to adapt to any device and screen.


