Categories
- All Categories
- Oracle Analytics and AI Learning Hub
- 44 Oracle Analytics and AI Sharing Center
- 20 Oracle Analytics and AI Lounge
- 278 Oracle Analytics and AI News
- 56 Oracle Analytics and AI Videos
- 16.2K Oracle Analytics and AI Forums
- 6.4K Oracle Analytics and AI Labs
- Oracle Analytics and AI User Groups
- 103 Oracle Analytics and AI Trainings
- 20 Oracle Analytics and AI Challenge
- Find Partners
- For Partners
Welcome to the Oracle Analytics Community: Please complete your User Profile and upload your Profile Picture
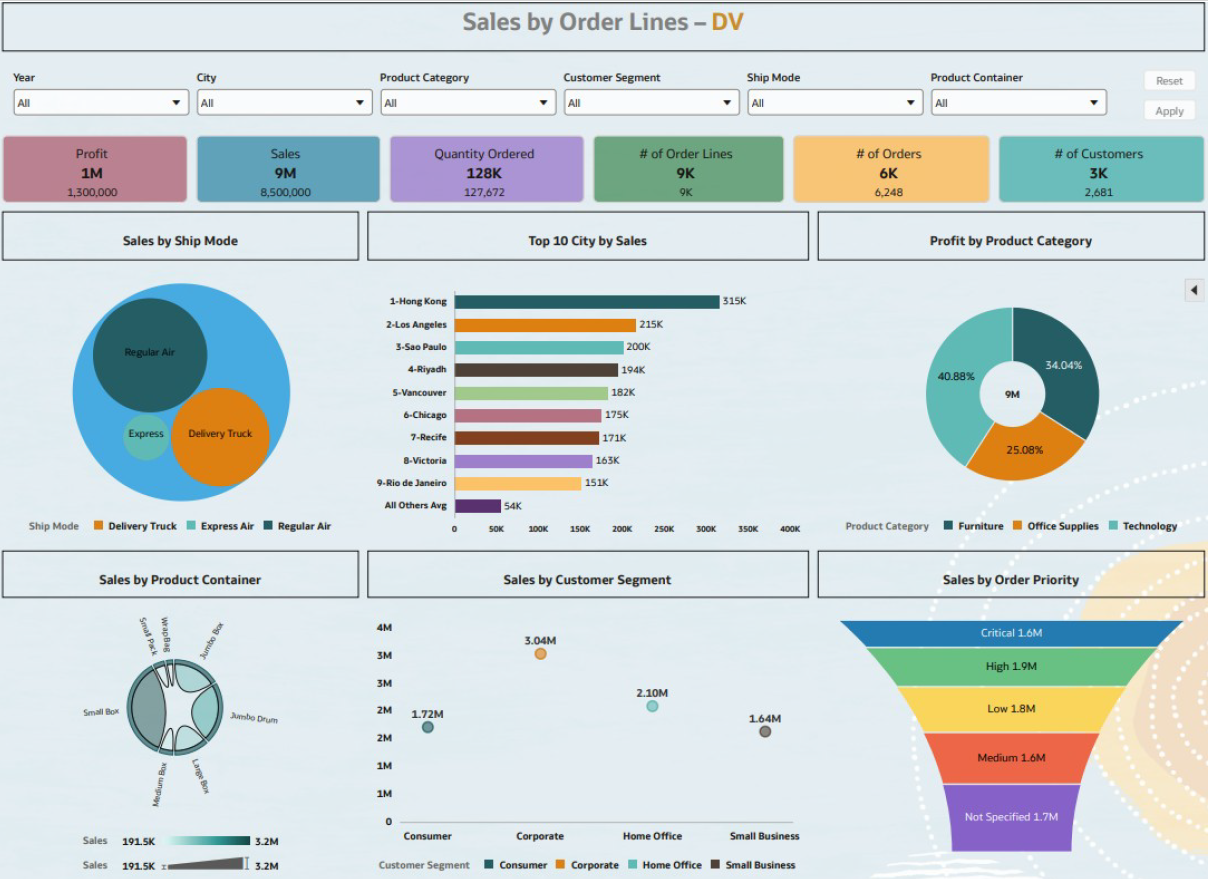
Sales Order Lines Dashboard
Swati_Singh-Oracle
Rank 4 - Community Specialist

Data Visualization depicting Overall Sales by Ship Mode, by Product Category, Top 10 City by Sales with its drill down to Map, Box Plots etc.
31
Comments
-
Very informative yet clean and nice workbook!
3 -
Beautiful visualizations & presentation.
Thanks for sharing @User_AXVG2!
1 -
nice work ..
1 -
looking good. I Hope this page is Accessibility Compliant.
1 -
Really informative and easy to follow. Great job.
1 -
Informative and nice working
1 -
Very good Dashboard and informative
1 -
Front End Matters and it's Matter's when it's Most Informative and self explanatory presentation makes much difference. Very Nice.
1 -
thank you so much @Farivar Javanbakhti-Oracle
1 -
thank you so much 😊
0

