Categories
- All Categories
- Oracle Analytics and AI Learning Hub
- 53 Oracle Analytics and AI Sharing Center
- 25 Oracle Analytics and AI Lounge
- 306 Oracle Analytics and AI News
- 57 Oracle Analytics and AI Videos
- 16.4K Oracle Analytics and AI Forums
- 6.6K Oracle Analytics and AI Labs
- Oracle Analytics and AI User Groups
- 118 Oracle Analytics and AI Trainings
- 22 Oracle Analytics and AI Challenge
- Find Partners
- For Partners
Welcome to the Oracle Analytics Community: Please complete your User Profile and upload your Profile Picture
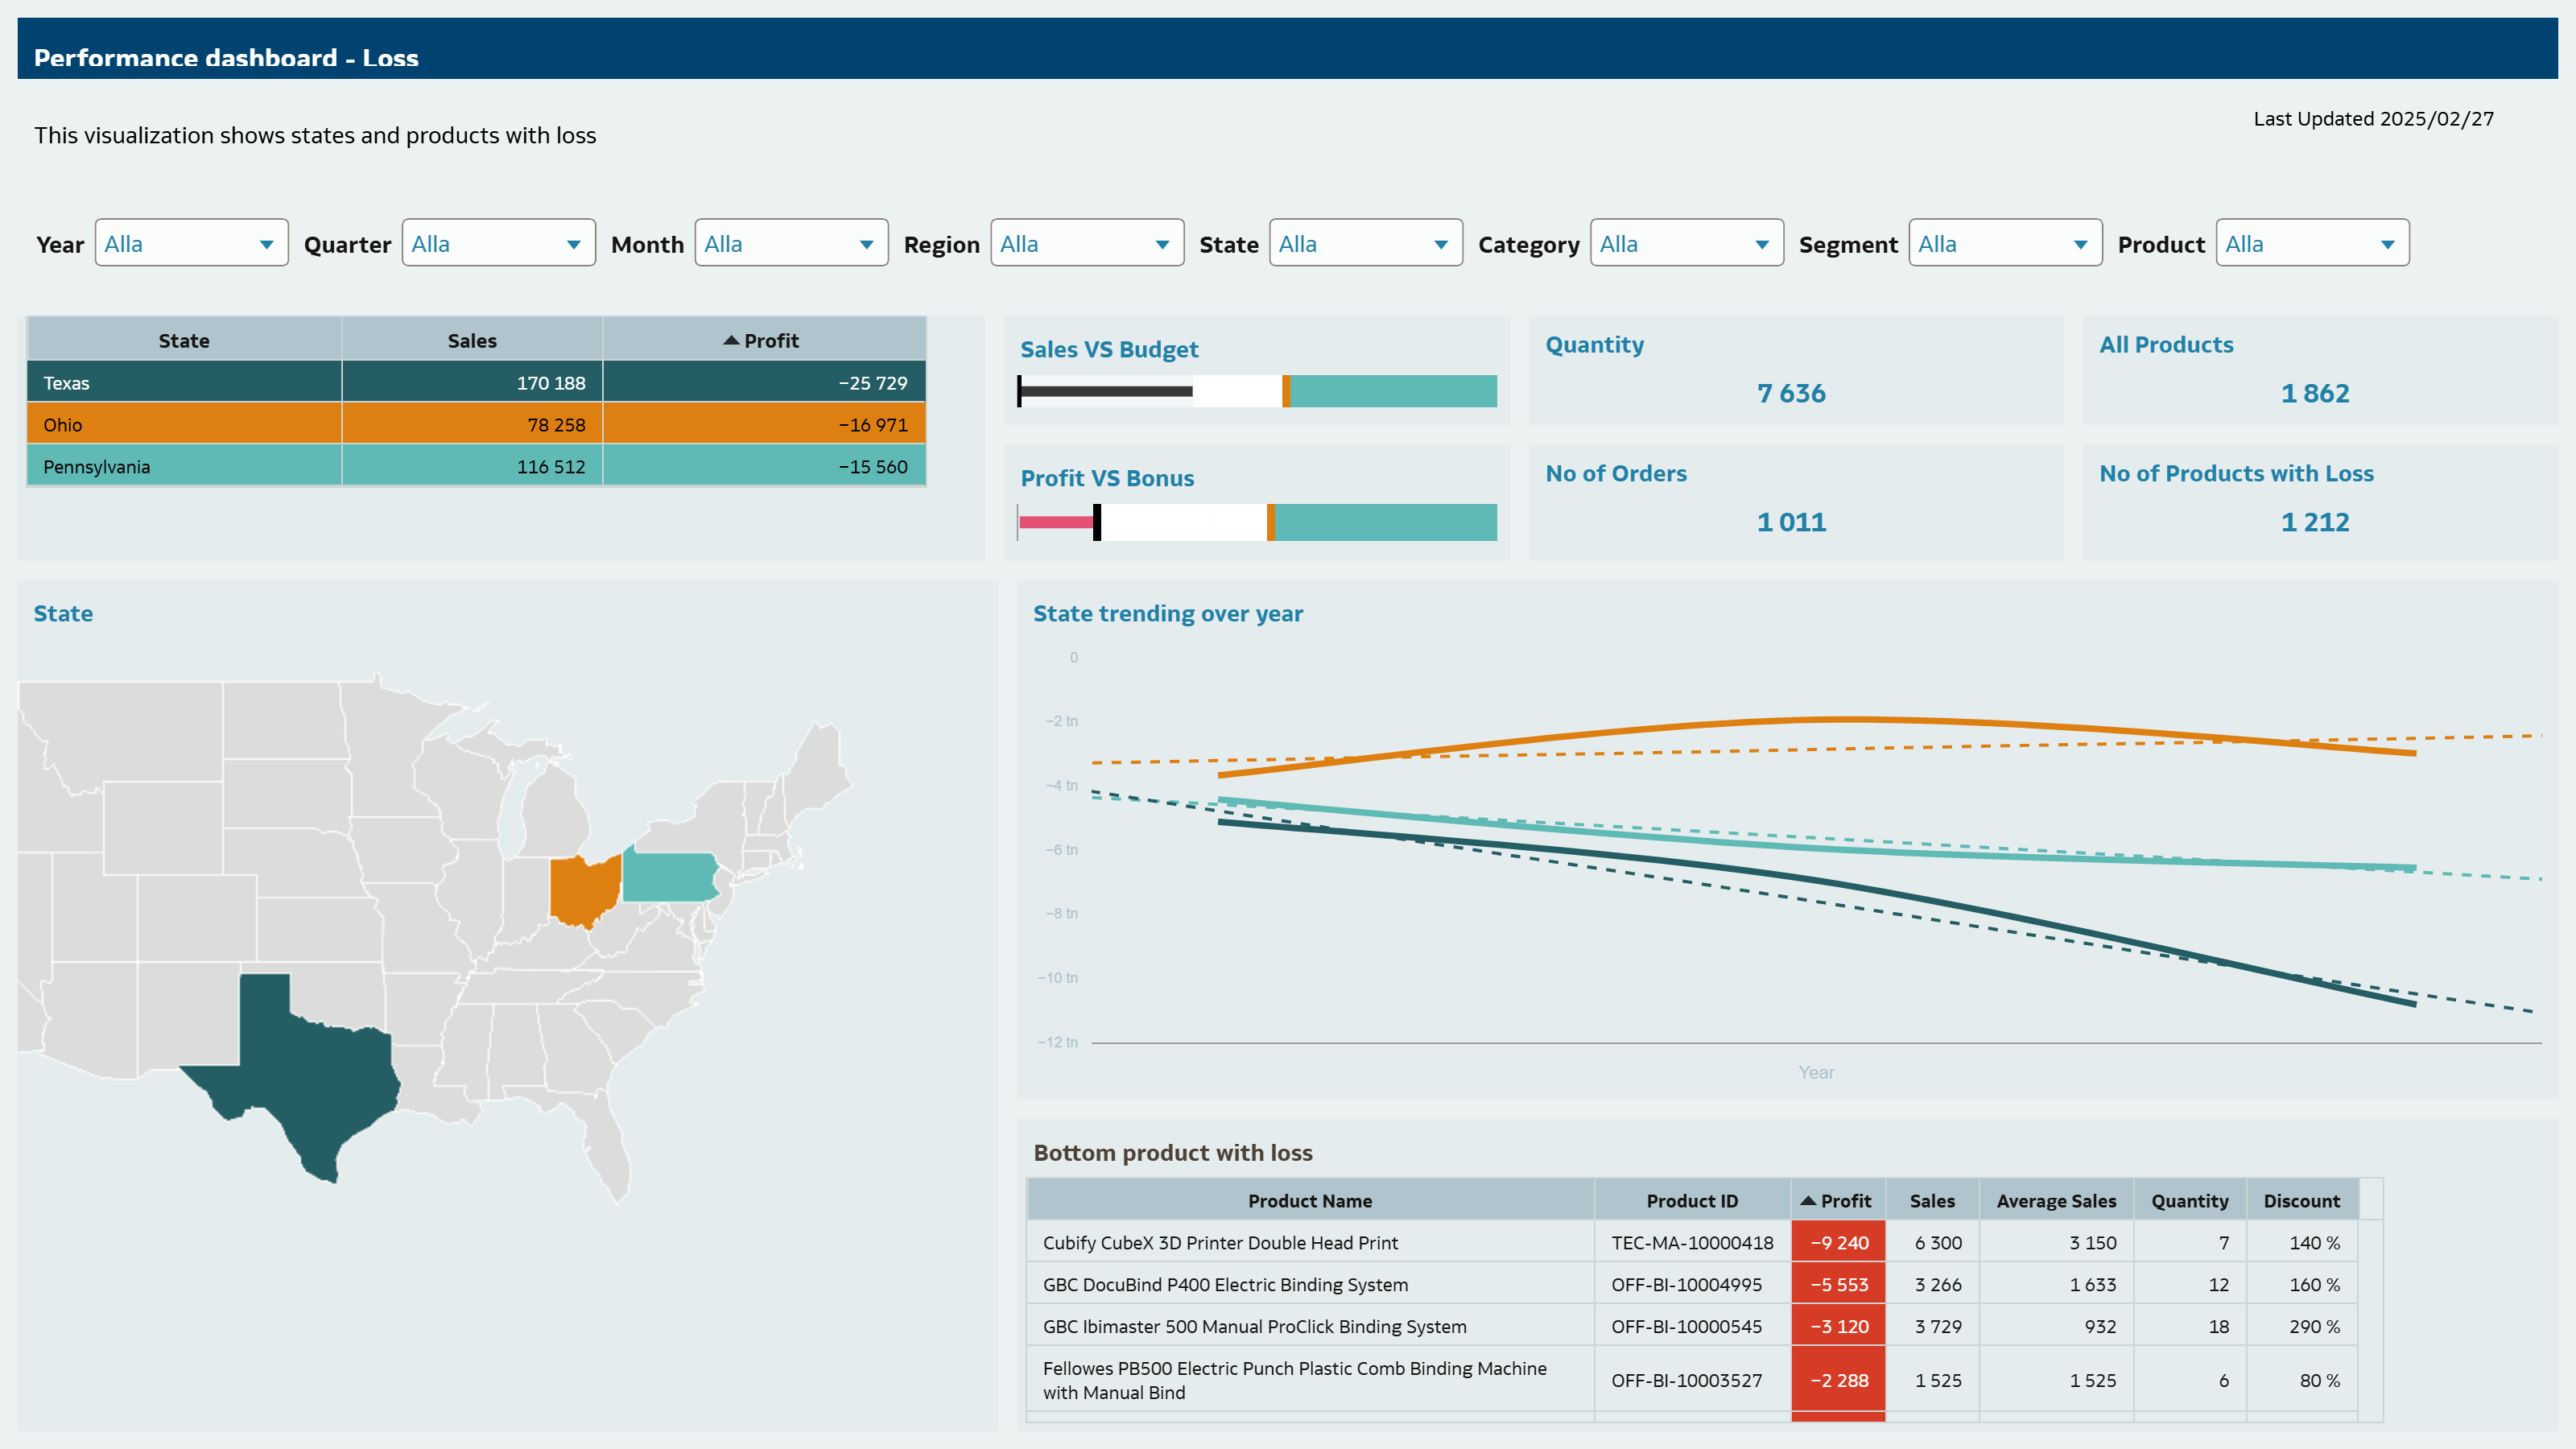
Loss analysis

Comments
-
@Halsen Nice work! The coloring of the states helps guide the viewer and easily track them over the data visualizations on your dashboard. The conditional formatting for bottom product with loss is a nice choice and helps to uncover and highlight actionable insights.
0
