Categories
- All Categories
- 15 Oracle Analytics Sharing Center
- 14 Oracle Analytics Lounge
- 211 Oracle Analytics News
- 41 Oracle Analytics Videos
- 15.7K Oracle Analytics Forums
- 6.1K Oracle Analytics Idea Labs
- Oracle Analytics User Groups
- 78 Oracle Analytics Trainings
- 14 Oracle Analytics Data Visualizations Challenge
- Find Partners
- For Partners
Welcome to the Oracle Analytics Community: Please complete your User Profile and upload your Profile Picture
How to create a hierarchical org chart visual from BIP Report?

Hassan Mohsin LC
Rank 1 - Community Starter
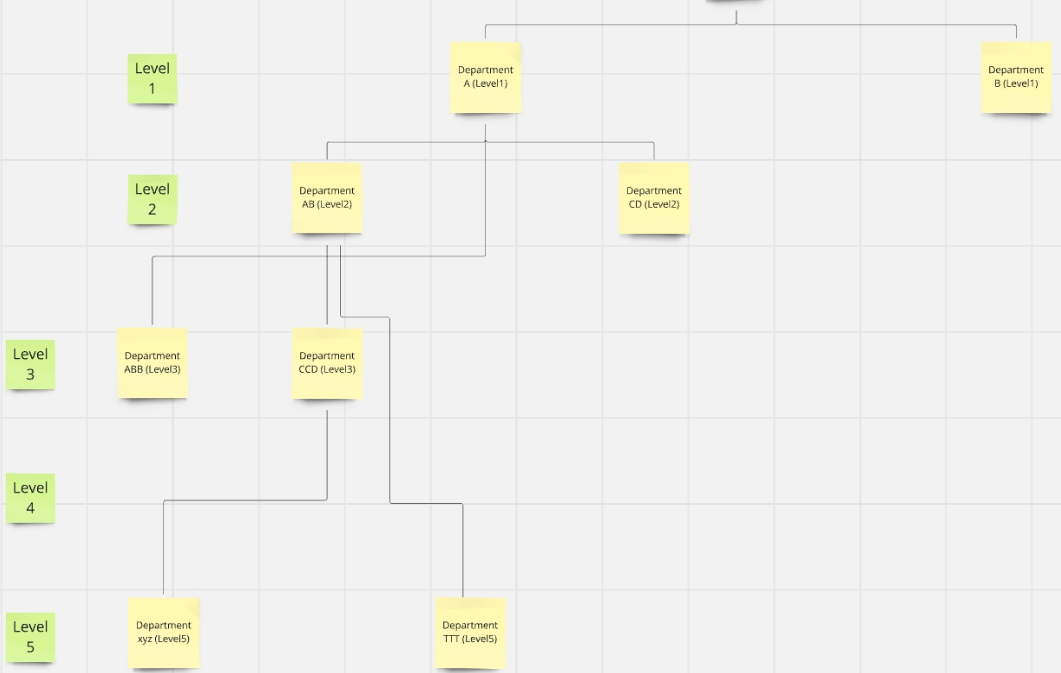
We have a DFF on Departments called Dept Level - represented in the yellow node.
There are cases where some level is missing, e.g. CCD has a L5 dept TTT underneath, and there is no L4 dept.
We are using BI Publisher data model which combines DFF and Dept Tree to get the 'custom' hierarchy
How can we build a visual like the one shown above?
0