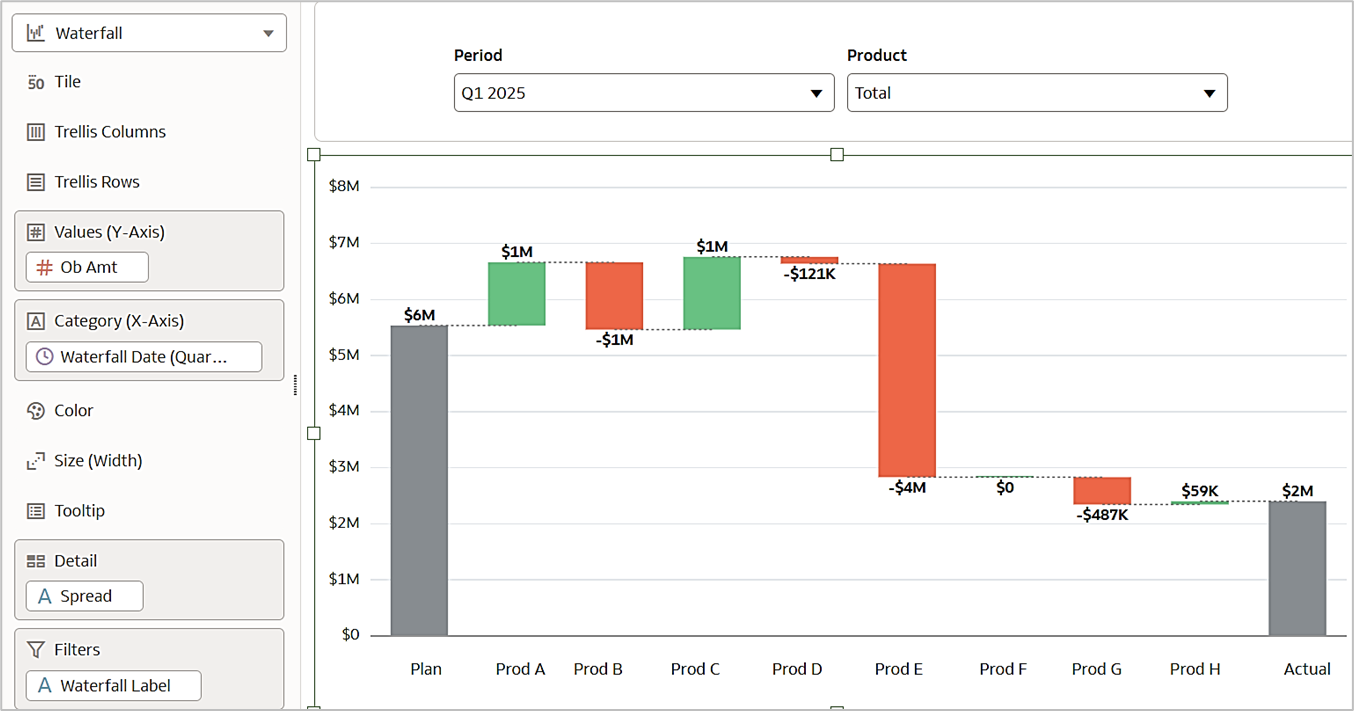
Currently to enable waterfall charts to walk from Plan to Actuals (within a single reporting period), I need to write a calculation to create an additional date column (specific only to these charts) that moves the Plan total into the prior quarter (to appropriately sum/present it within the Start bar). This then requires an additional concatenate statement layered into a filter with text boxes placed over the Start and End bars to display "Plan" and "Actual" (as shown below) for the dashboard consumer. If there was a method to have the chart walk data that is labeled as Plan to the corresponding data labeled as Actual in the underlying dataset (e.g., the x-axis could have an attribute drive it instead of just date fields), this would save time and increase re-usability for the waterfall outputs created.