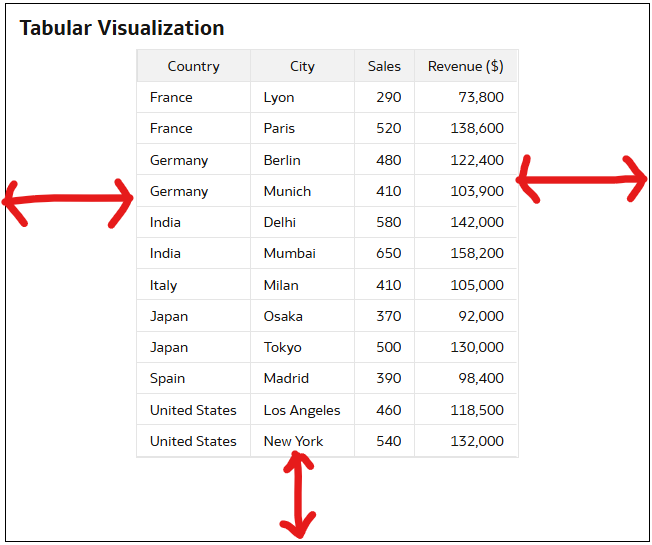
Hello….As shown in the below Tabular visualization. Can anyone pls tell how to remove Padding from the 3 sides of the Table ?.We want to remove padding for different widget sizes and also different screen sizes.
Your assumption is that there is a padding setting outside the table, while the existing setting is the width of the columns inside the table visualization.
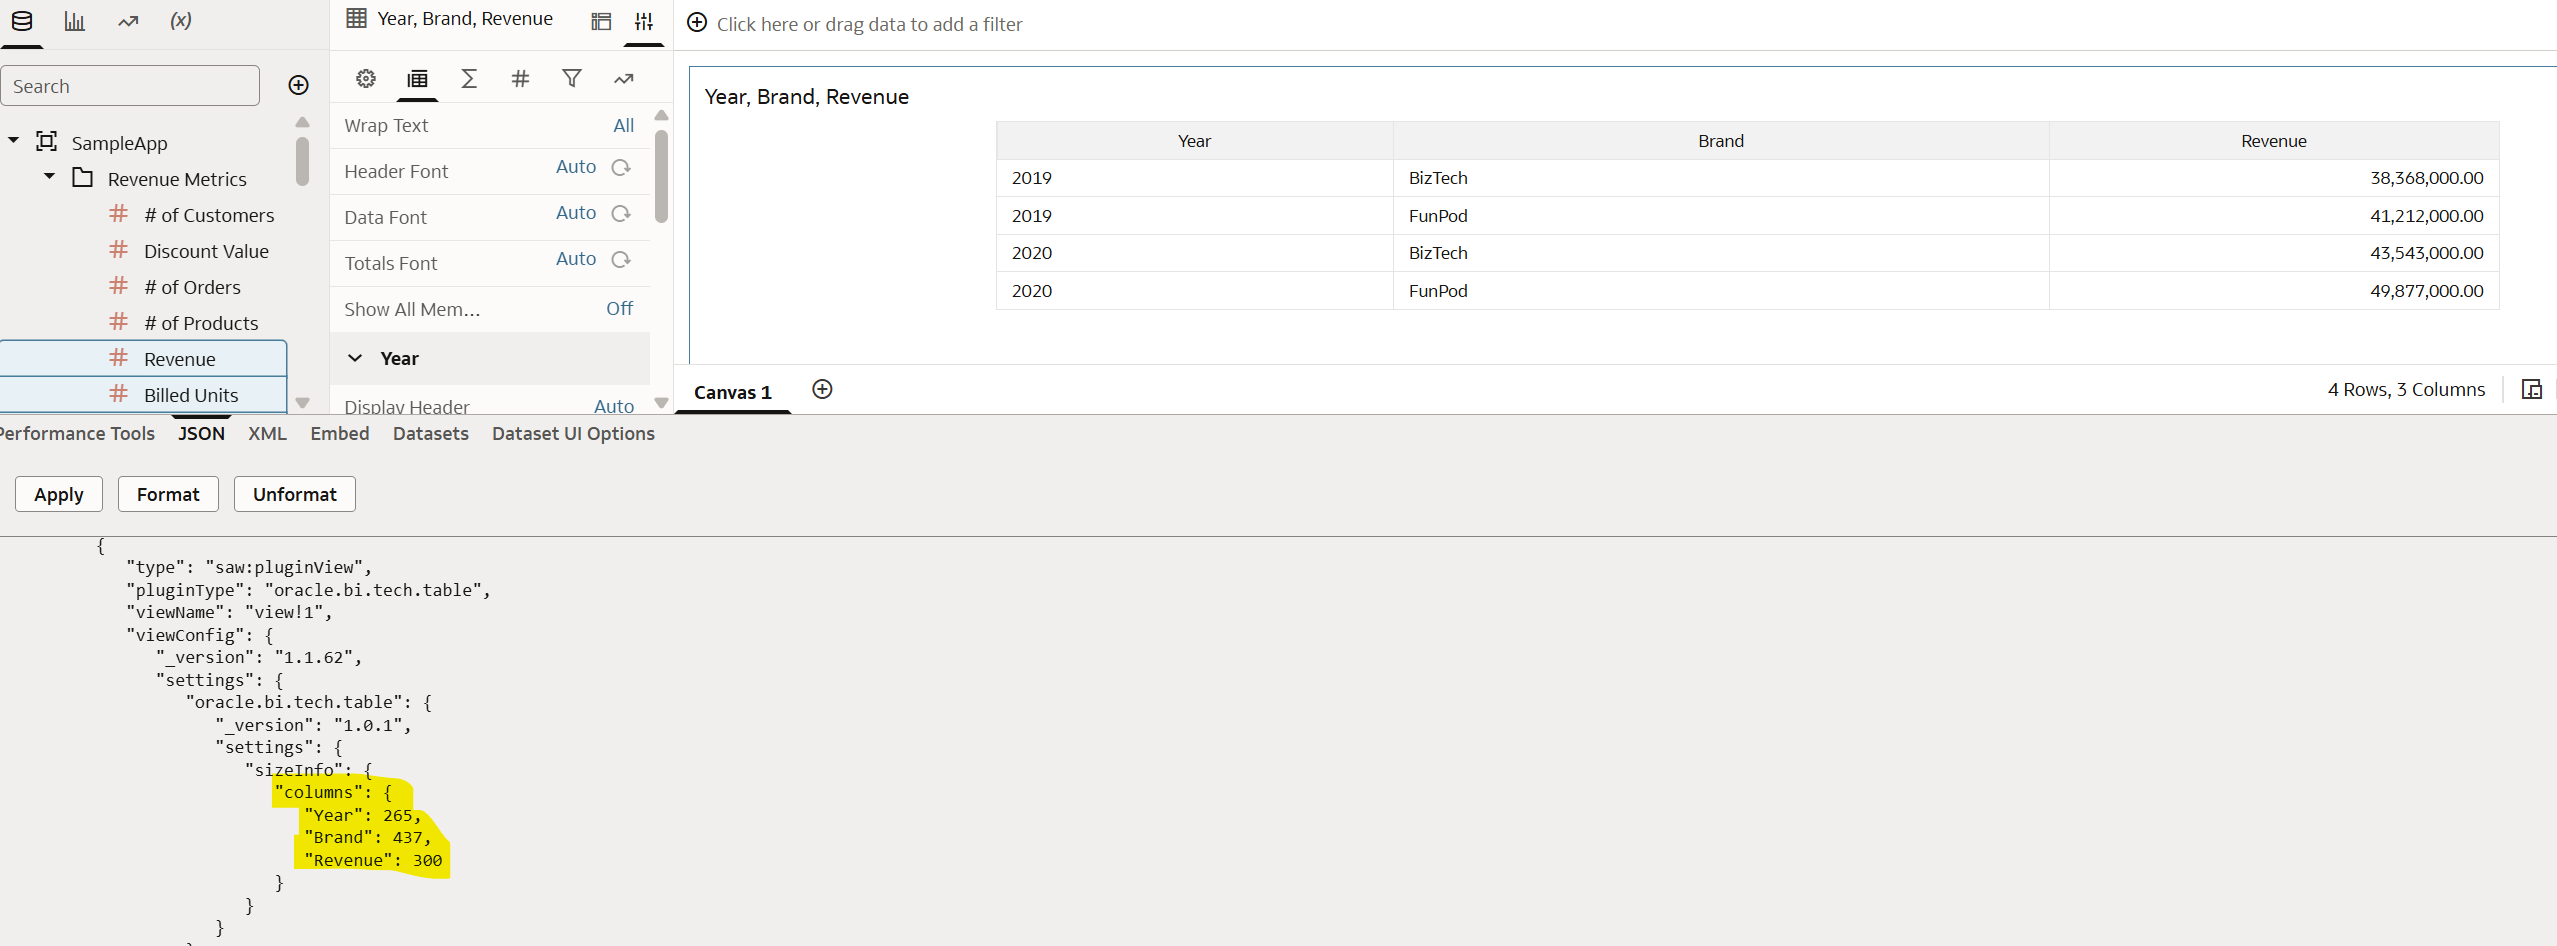
If you change the width of the columns you see that the values are saved as a property of the view itself in the workbook. The challenge is that if you use 2 different screens, because the setting is the width of the columns and not the spacing outside it, one time there will still be lot of empty space, another time the table will be too wide and you will have an horizontal scroll.
That's what you can do, not more, not less…
It's typically one of those cases when you need to tell your customer that the requirement "doesn't work" (explaining the basics of why, without too many details), and it's better to focus on the real features and functionality of the product instead of messing around with hardcoded sizing of each column, that will break as soon as somebody has a different screen resolution or resize the window.
@Hasan Sd, as per my understanding, Oracle automatically applies responsive padding to ensure readability across screen sizes, this is not exposed as a property in DV.
@RVohra ,yes the padding is responsive, however our client's requirement is to remove them or keep it very less like 5 or 10 px. Any option to do this ?
Explore how to build agents using code in AI Data Platform. We'll create an agent that examines and analyzes the contents of a Github repository and reports its findings. The session demonstrates how to use different developer tools to create agents including the AIDP extension for VS Code and Codex. Using these tools we…
What is wrong with this code
Am I missing something or is there no way to search through previous posts to make sure I don't duplicate a question? All I see on the filter options are tags or status… a general search for a word or phrase would be helpful.
We were under the impression that when exporting a visualization in DV to CSV format hidden columns would be include from the grammar panel. This is not happening. See below for a screenshot showing 3 hidden columns that do not appear when exporting the pivot table to CSV. This seems to have worked a month or so back but…
Migrated RPD from obiee12c to OAS 2024. post migration when we try to access dashboards on OAS we are getting below error: State: HY000. Code: 10058. [NQODBC] [SQL_STATE: HY000] [nQSError: 10058] A general error has occurred. (HY000) State: HY000. Code: 43275. [nQSError: 43275] Message returned from OBIS…
There is no option for legend title in many visualization types.