1. Which dataset did you use?
HRDataset_v14 (Version 14, updated January 2023), a publicly available HR dataset originally authored by Dr. Carla Patalano and Dr. Rich Huebner, available on Kaggle. The dataset contains 311 employee records with 36 attributes including recruitment source, department, manager, performance scores, engagement survey results, employment status, and termination reasons.
The dataset is licensed under CC-BY-NC-ND 4.0 (Creative Commons Attribution-NonCommercial-NoDerivatives 4.0 International License) and was used here for learning and educational purposes in accordance with the authors' licensing terms.
Human Resources Data Set
2. How did you analyze or prepare the data?
The dataset was analyzed directly in Oracle Analytics Cloud, where I created multiple calculated fields to deepen the investigation beyond raw data:
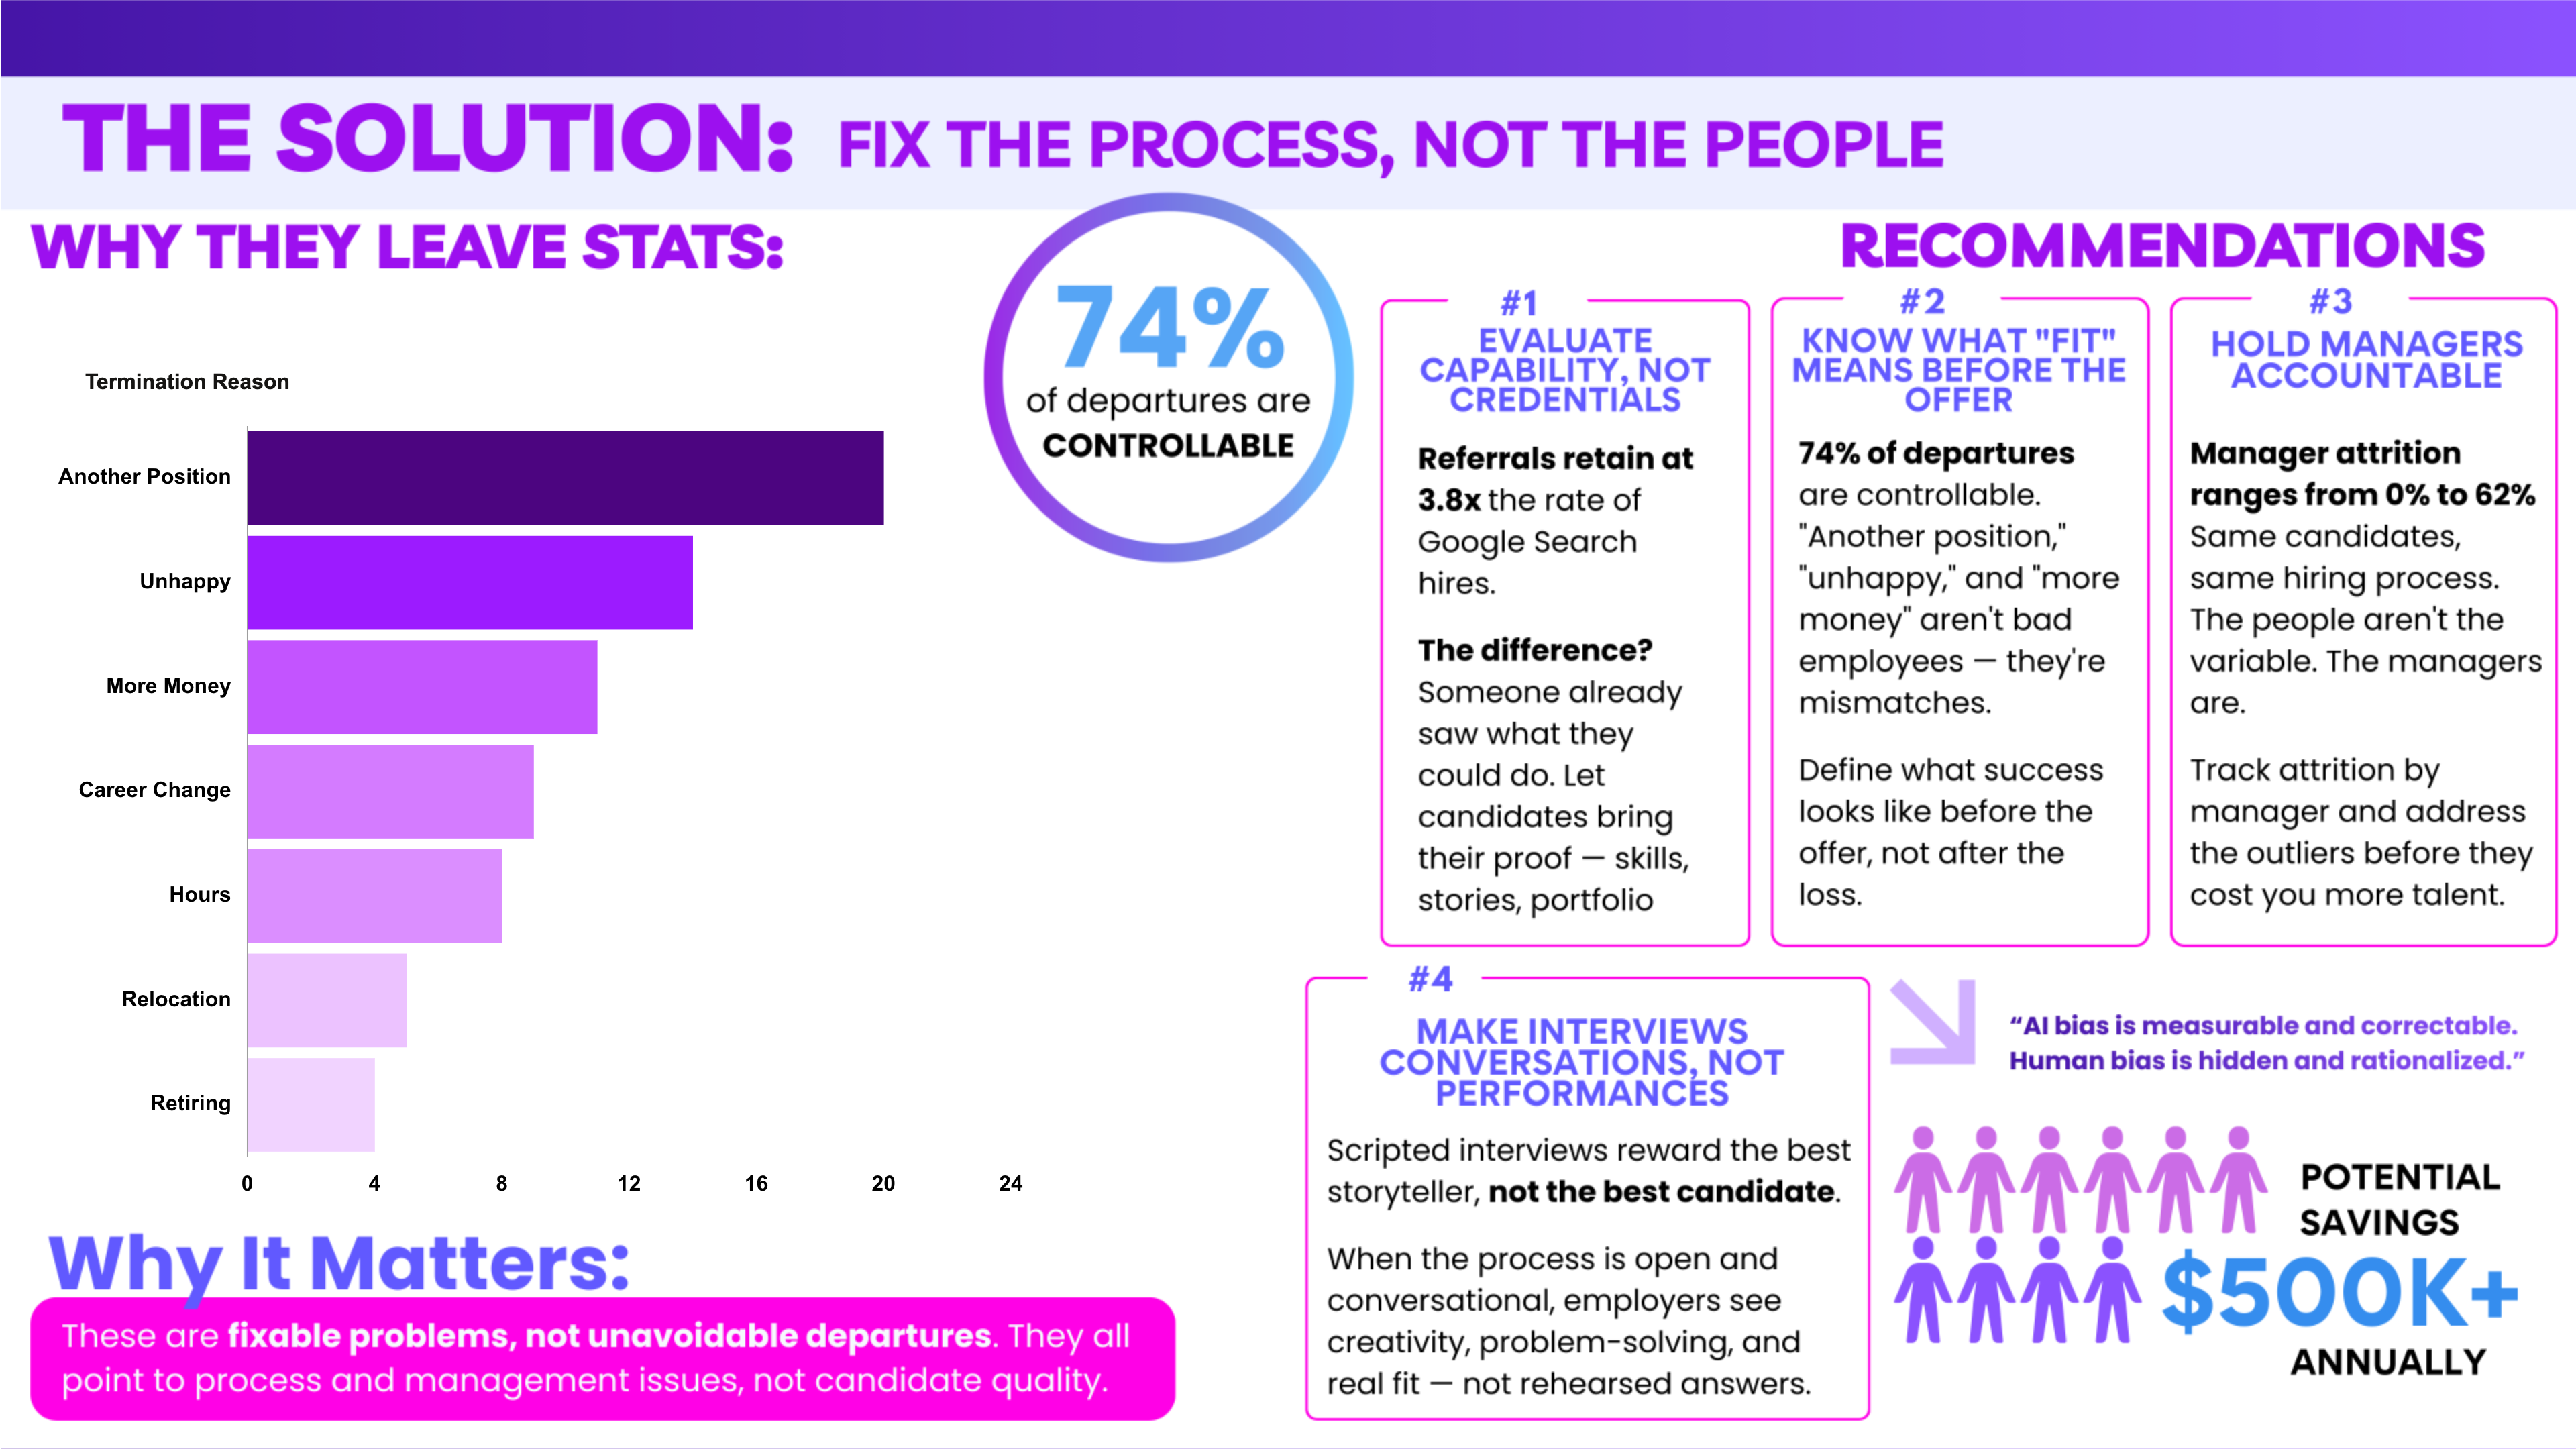
- Attrition rate by recruitment source revealing the 3.8x retention difference between Google Search and Employee Referral hires
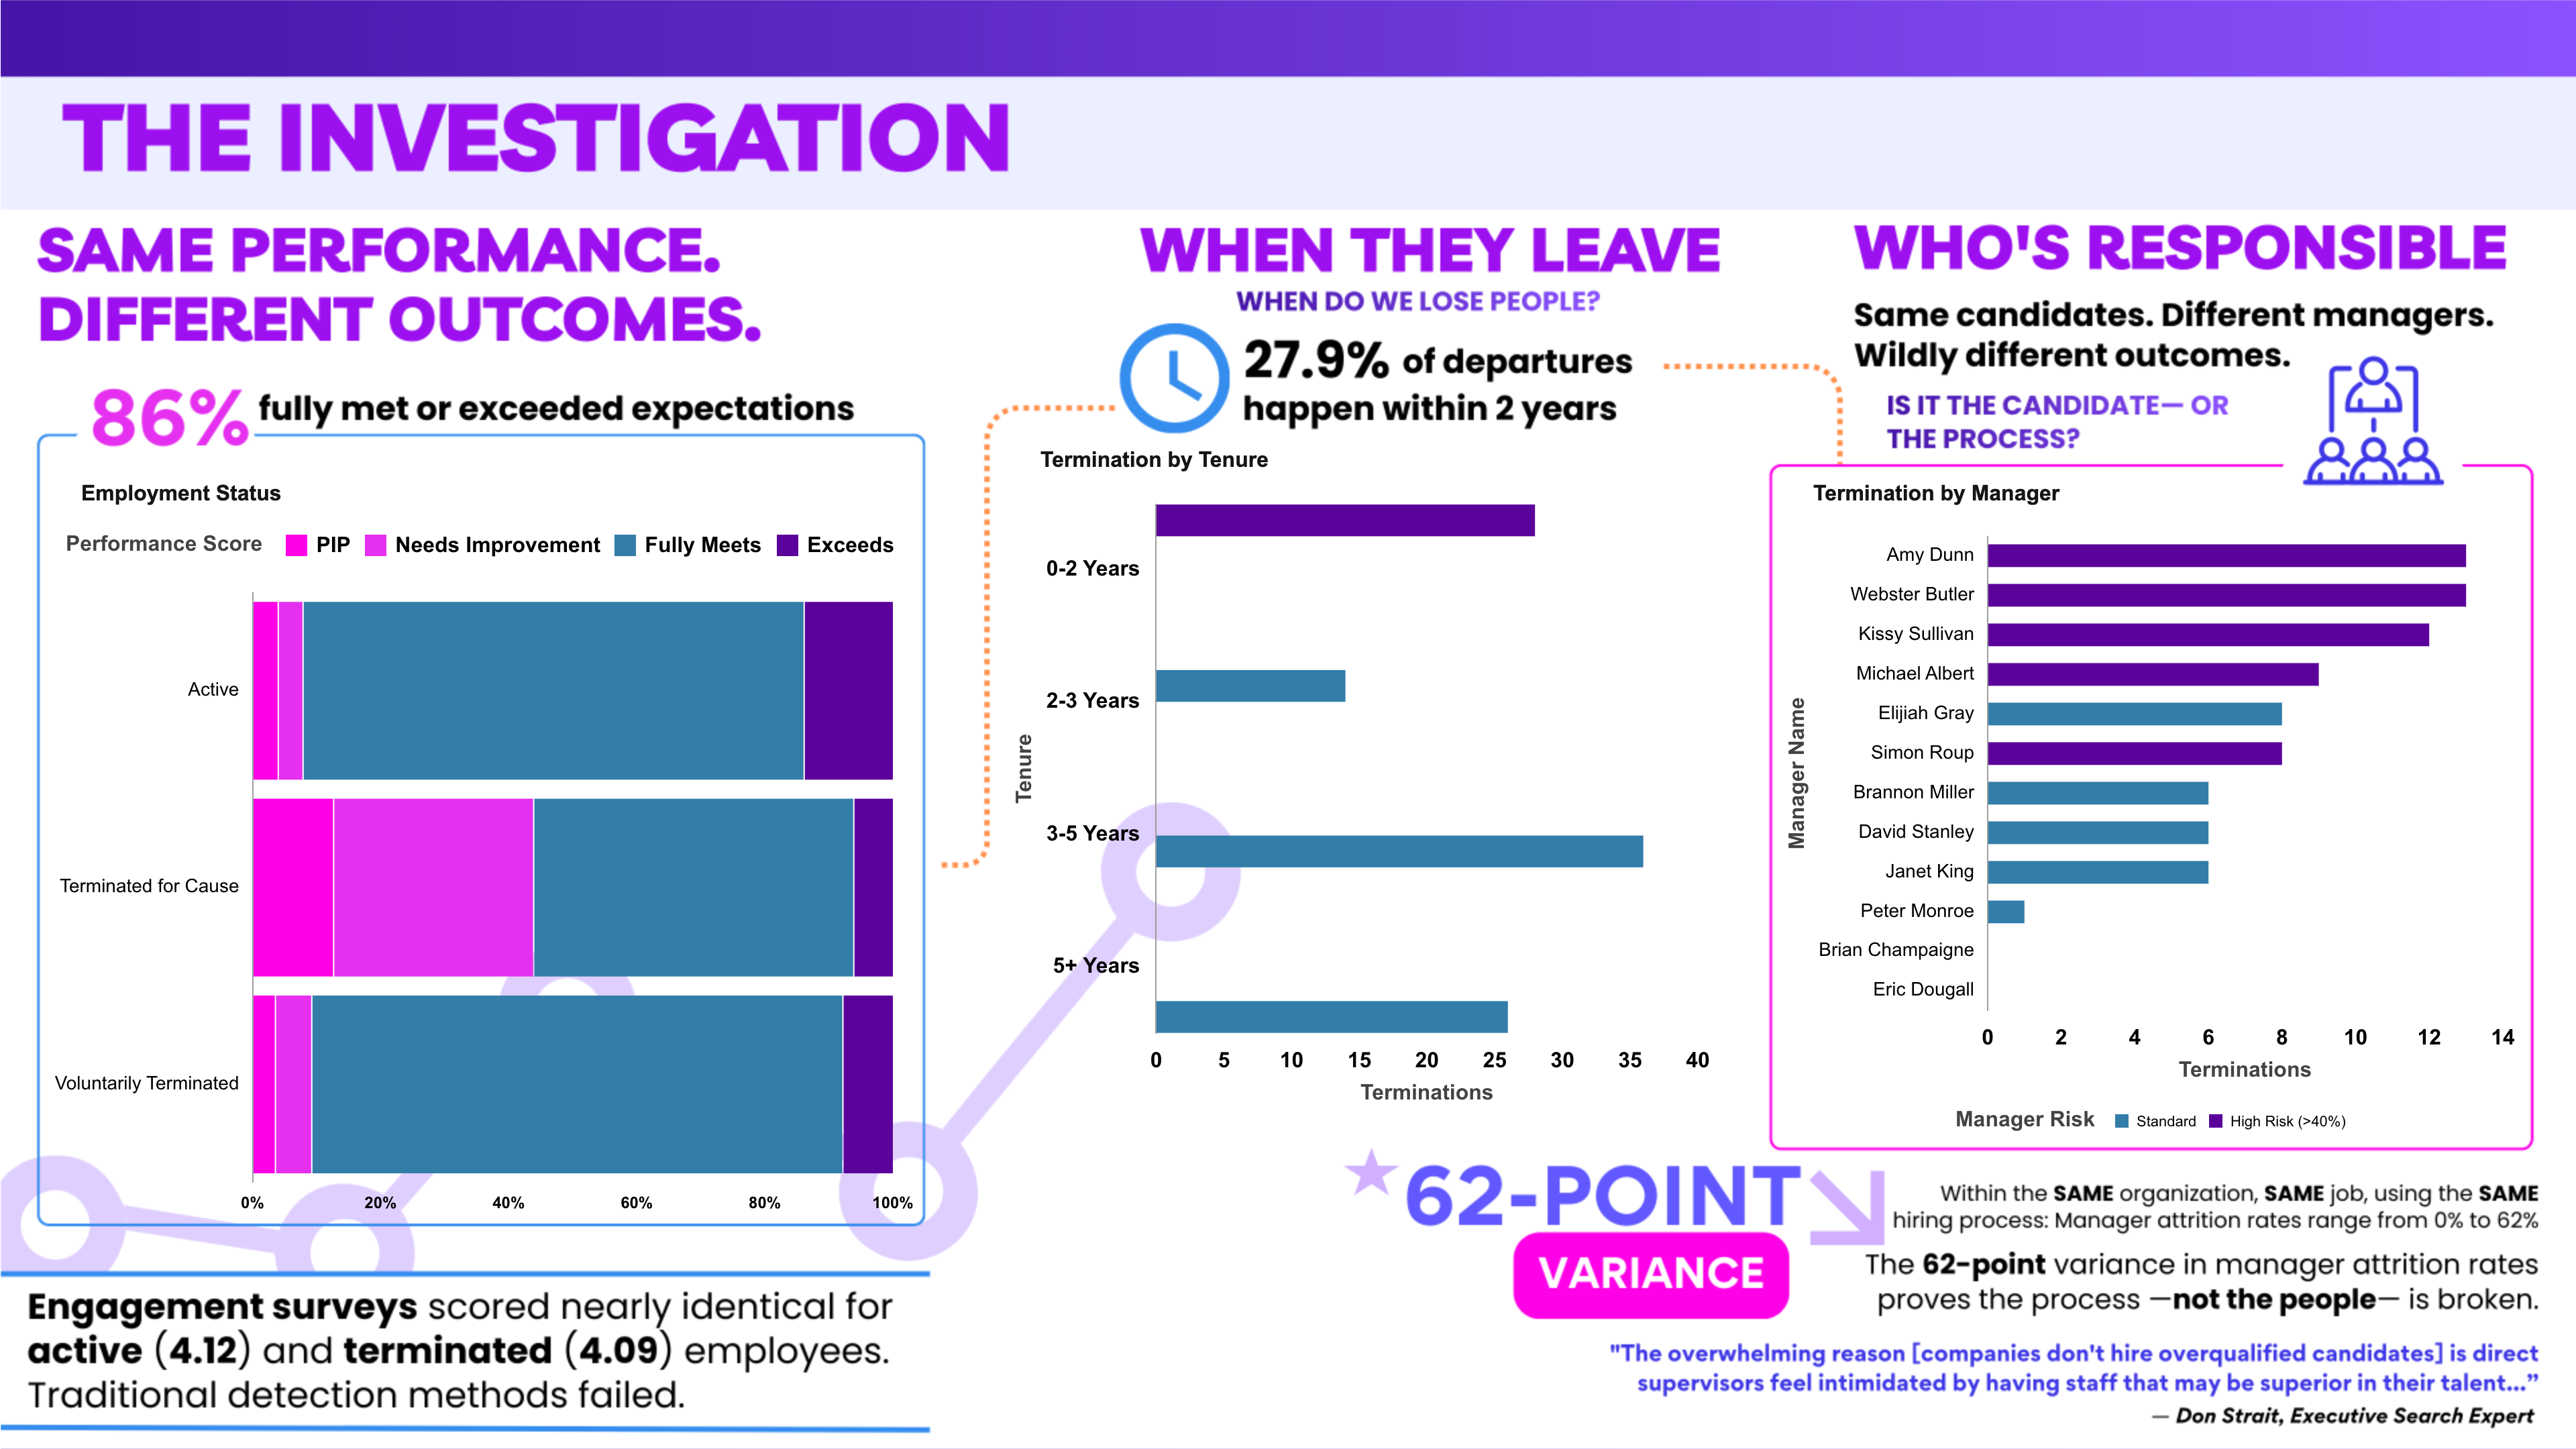
- Tenure groupings identifying early attrition patterns (27.9% leave within 2 years)
- Manager Risk classification flagging managers with attrition rates exceeding 40% as high-risk outliers
- Controllable vs. uncontrollable termination categorization showing 74% of departures are fixable
- Performance comparison across employment status groups proving 86% of terminated employees met or exceeded expectations
- Engagement survey averages by termination status testing whether traditional detection methods identified at-risk employees (they didn't — active employees scored 4.12 vs terminated at 4.09)
3. Who is the intended audience for your visualization?
This targets leaders who suspect turnover is a candidate quality problem and haven't yet examined whether the hiring process itself is the root cause. Specifically:
- HR leadership and CHROs responsible for hiring strategy and retention
- Executive decision-makers managing workforce cost
- Talent acquisition teams evaluating recruitment source effectiveness
- Department leaders overseeing managers with high attrition
4. What is your visualization about, and what question or problem does it address?
"The Hidden Cost of Hiring Misalignment" investigates a provocative question: Is our hiring process setting employees up to fail?
The analysis reveals that the $3.4M annual cost of attrition isn't driven by bad candidates. In fact, 86% of terminated employees met or exceeded performance expectations. Instead, the data exposes human bias in the hiring process: Google Search hires (where managers screen resumes) leave at 3.8x the rate of Employee Referrals (where someone has already validated the candidate's capabilities). A 62-point variance in manager attrition rates (0% to 62%) proves that managers, not candidates, are the variable. The visualization progresses from identifying the cost, through a multi-dimensional investigation, to actionable solutions that address the process rather than blaming the people.
Canvas-by-Canvas Flow:
Canvas 1 ("The Hidden Cost") establishes the $3.4M problem and reveals the 3.8x recruitment source finding.
Canvas 2 ("The Investigation") examines performance, timing, and manager impact, ruling out alternative explanations and identifying who's responsible.
Canvas 3 ("The Solution") delivers data-backed recommendations to fix the process, with $500K+ in potential annual savings. All charts filter interactively within each canvas, allowing the audience to explore the data by department.
5. Did you use any Oracle Analytics AI features when building your visualization (ex. AI Assistant)? If so, please describe how they were used.
While I didn't use Oracle Analytics' built-in AI features, I leveraged an external LLM as a strategic thought partner for refining the investigative narrative, stress-testing my analytical conclusions, and ensuring the dashboard told a cohesive data story. All calculated fields, data analysis, and visualizations were built manually in OAC.